Project 01
Formula Student Aerodynamic Package Optimization
Genetic-algorithm optimization of the FalconE aerodynamic package, from multi-element wings and diffusers to an 8.15-million-cell full-car CFD study. The report documents ride-height sensitivity, composite manufacture and qualitative rear-wing tuft testing.
Project overview
Component optimization, vehicle-level evidence
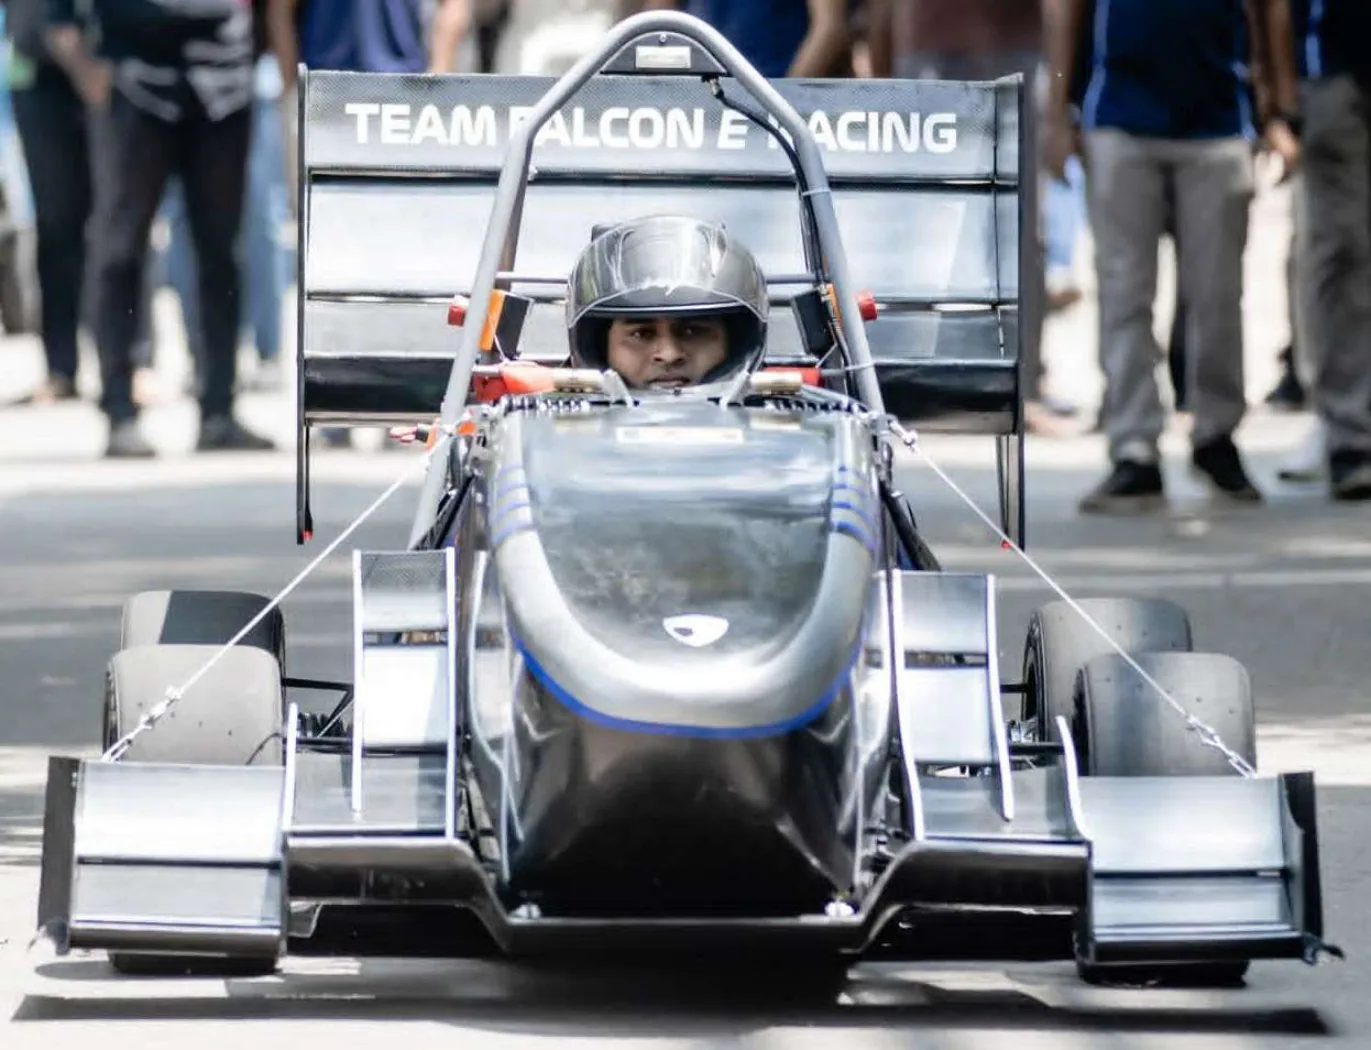
Developed a coordinated aerodynamic package for FalconE Racing: a multi-element front wing, four-element rear wing, side diffusers and rear diffuser. Parametric CFD and genetic algorithms explored downforce, drag and component interactions before a vehicle-level study. The portfolio’s previously supplied 1,600+ simulations and 310%+ simulated improvement describe the wider programme; this report does not provide the baseline comparison needed to independently verify that percentage.
Full-car CFD cells
Simulated downforce · 22.5 m/s, 30 mm ride height
Aero package mass target
01 / Design objectives
Downforce within a constrained package
The design targets were an aero package of no more than 15 kg and 15 m/s (54 km/h) cornering speed. With a 328 kg vehicle-and-driver assumption, a 15 m corner radius and tyre friction coefficient of 1.30, the report calculates 566.8 N required downforce, split 54% front (306.1 N) and 46% rear (260.7 N). These are targets, not measured outcomes.
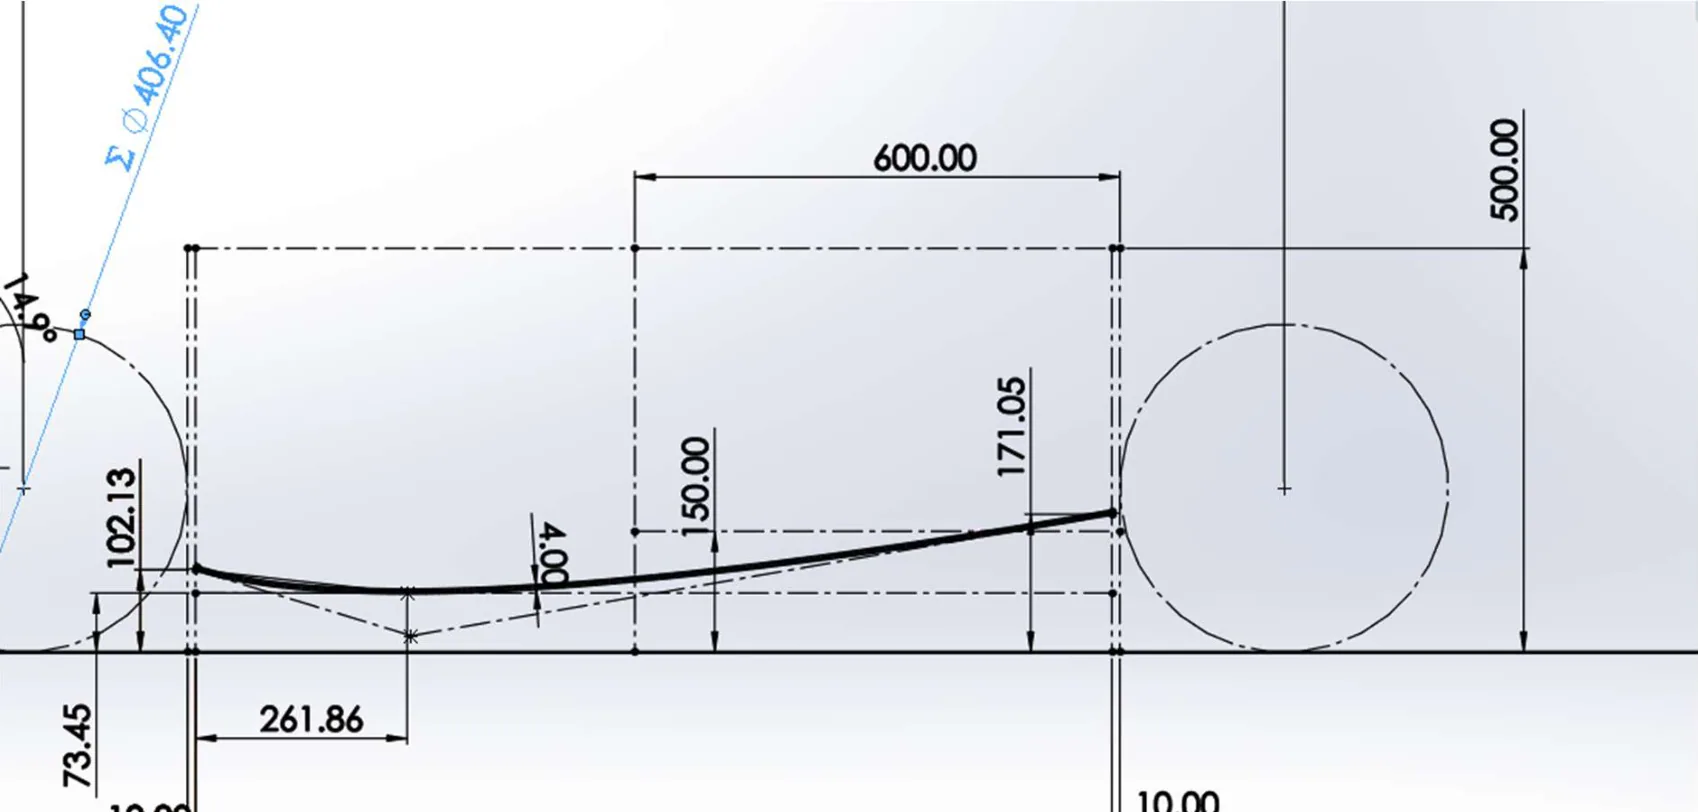
Eleven candidate airfoils were compared for lift, stall behaviour, angle-of-attack range and manufacturability. Trailing-edge thickness mattered as well as aerodynamic performance; different profiles were selected for different elements rather than assuming one airfoil suited the entire package.
02 / Optimization workflow
Genetic algorithms for nonlinear flow
ANSYS Fluent with k-ω SST supplied the CFD evaluations for sequential multi-objective genetic algorithm (MOGA) studies in ANSYS DesignXplorer, using a controlled-elitism NSGA-II approach. Each stage carried the previous optimum forward. Aerodynamic efficiency throughout these studies means the ratio of downforce to drag (downforce ÷ drag), not an energy-conversion efficiency. A separate custom design-of-experiments study used a Kriging response surface with a stated 5% tolerance.
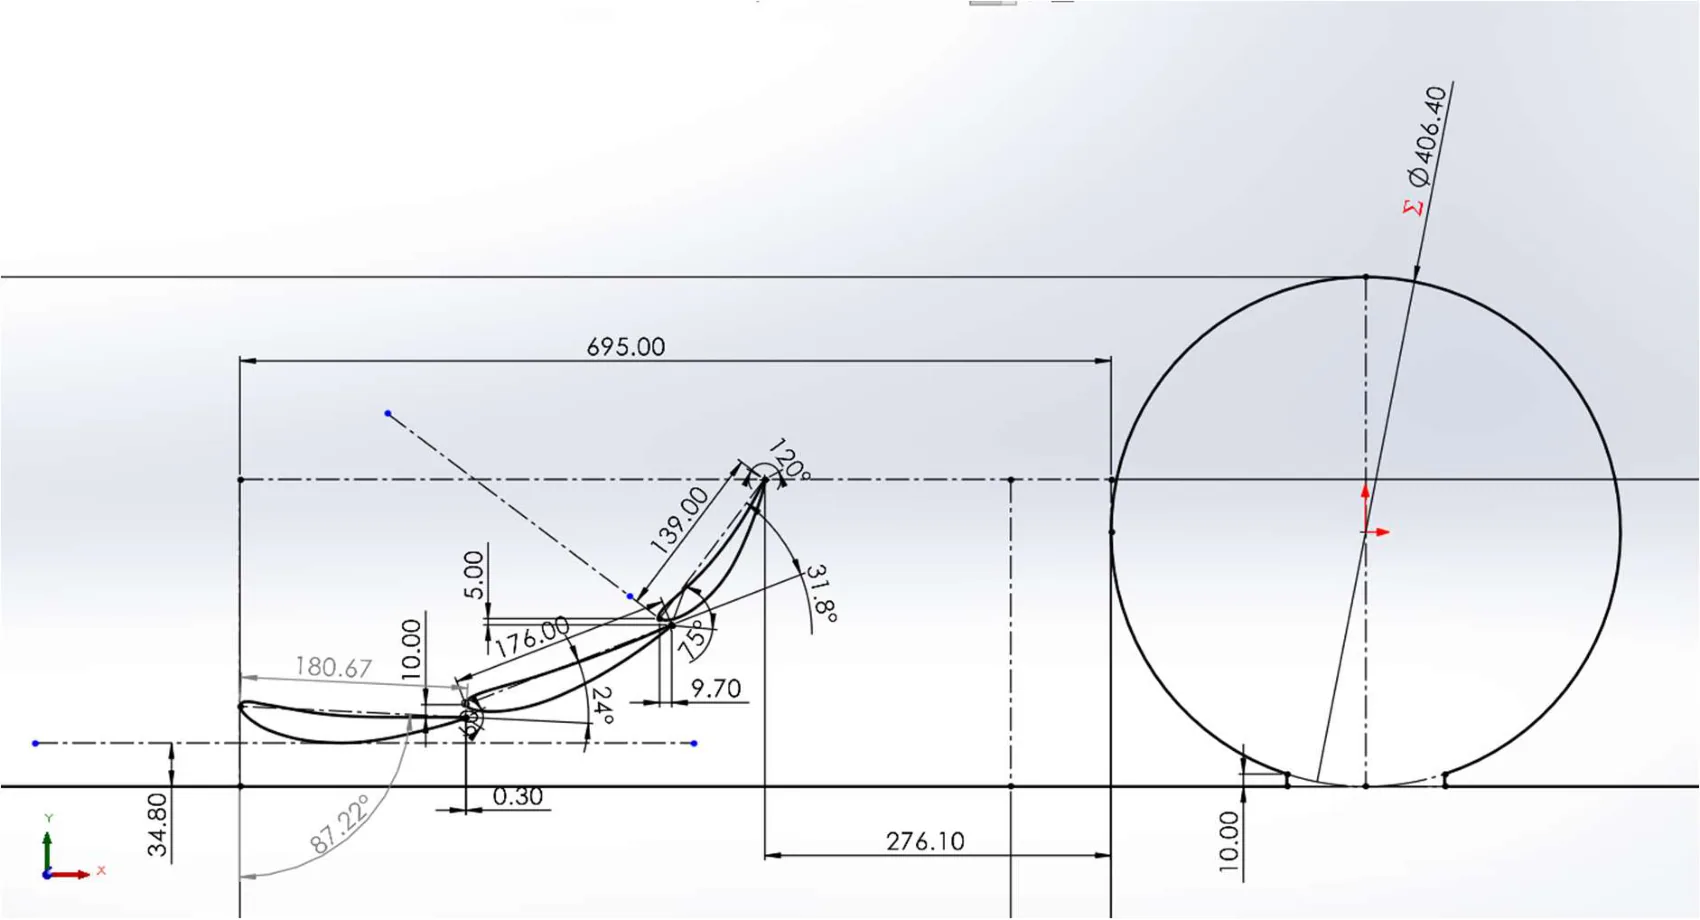
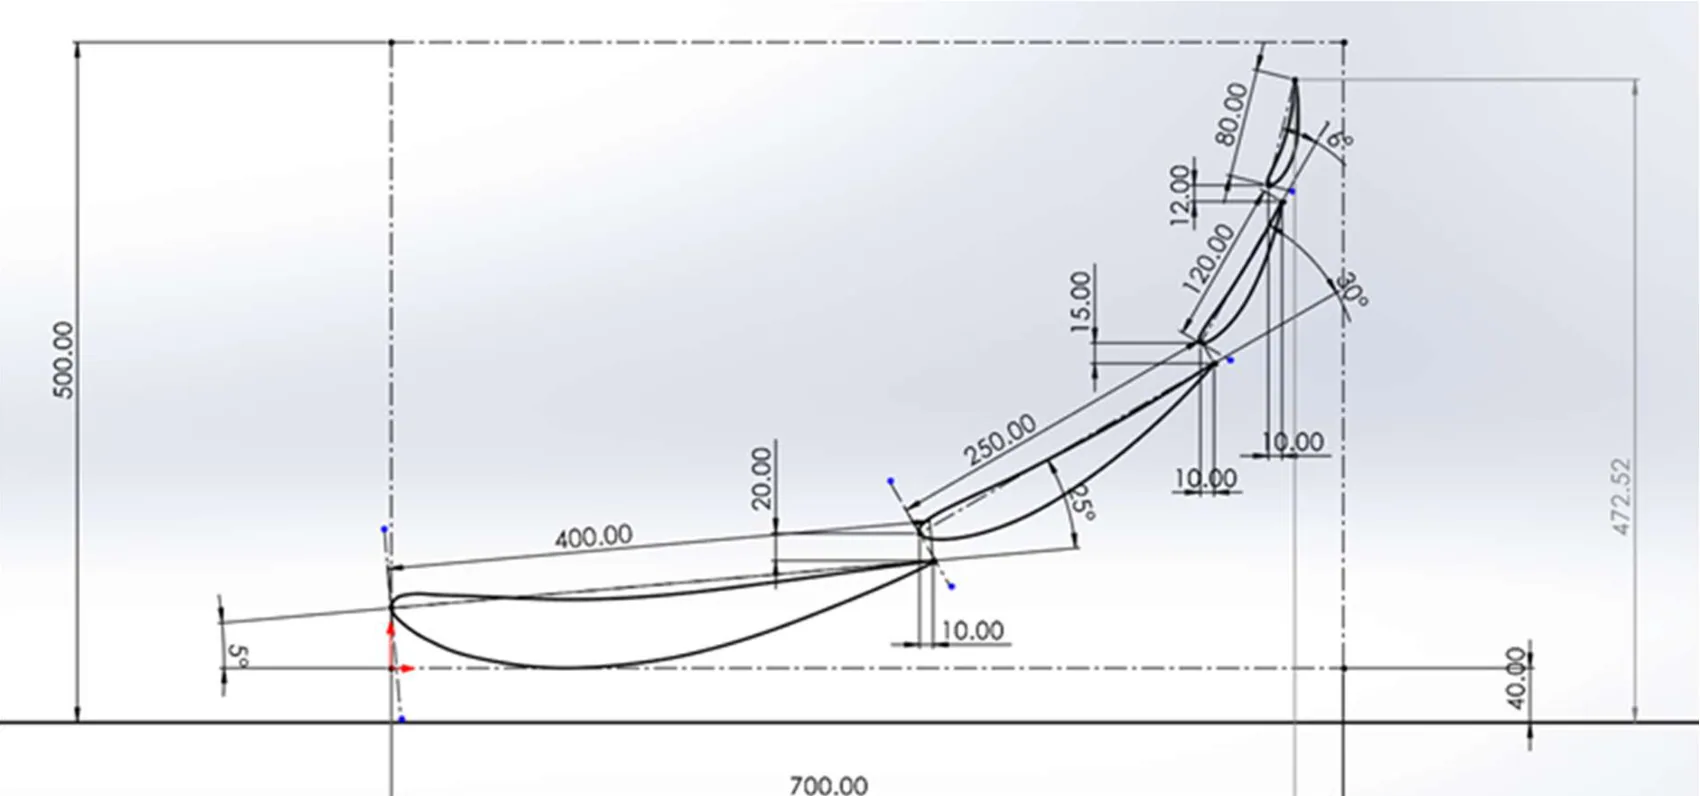
The three-element front wing underwent three optimization stages: spatial positioning and ground effect (124 design points, 6 iterations), flap chord lengths and angles of attack (436 design points, 7 iterations), and slot gaps and overlaps (211 design points, 8 iterations). Downforce was maximized with a downforce-to-drag ratio above 3; the final section ratio was 6.66.
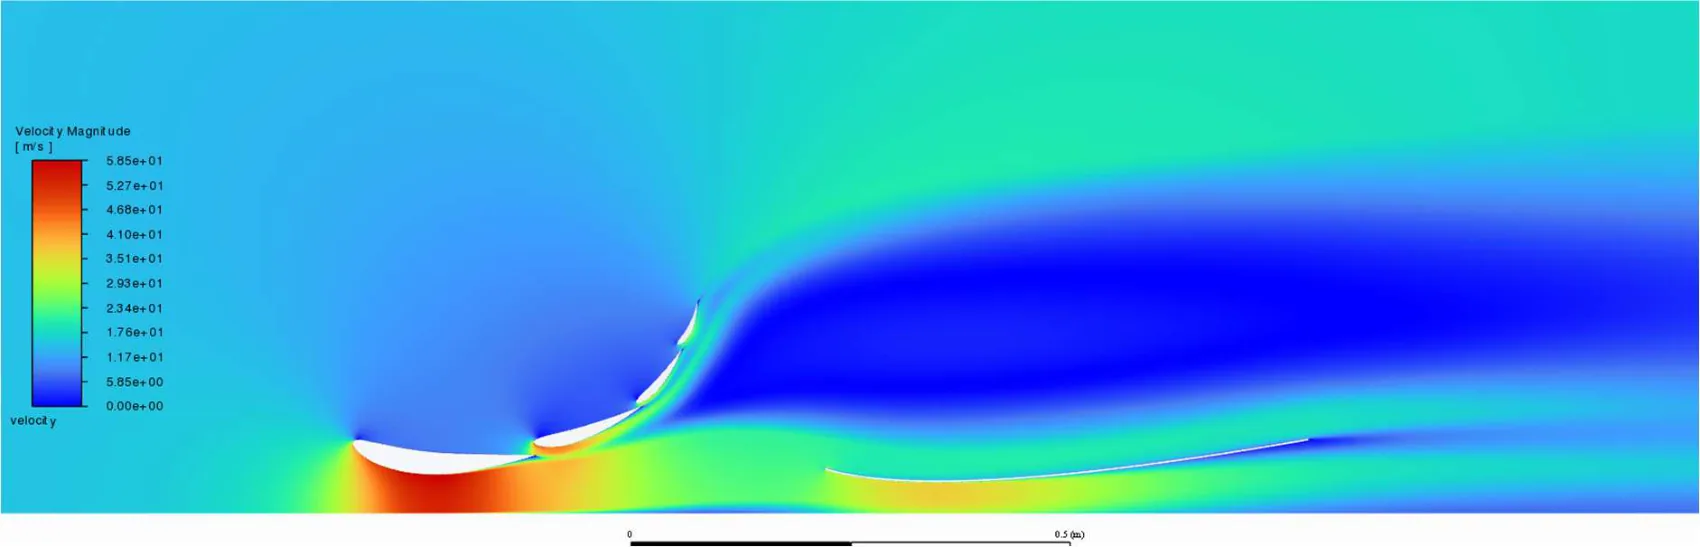
The four-element front wing also used three stages: ground clearance and flap chord lengths (501 design points, 9 iterations), flap angles of attack (670 design points, 15 iterations), and slot gaps and overlaps (436 design points, 11 iterations). The objective maximized downforce while constraining downforce-to-drag ratio to at least 10. The optimized section ratio was 12.70; the separately studied central element achieved 26.38. These are 2D section results, not full-car forces.
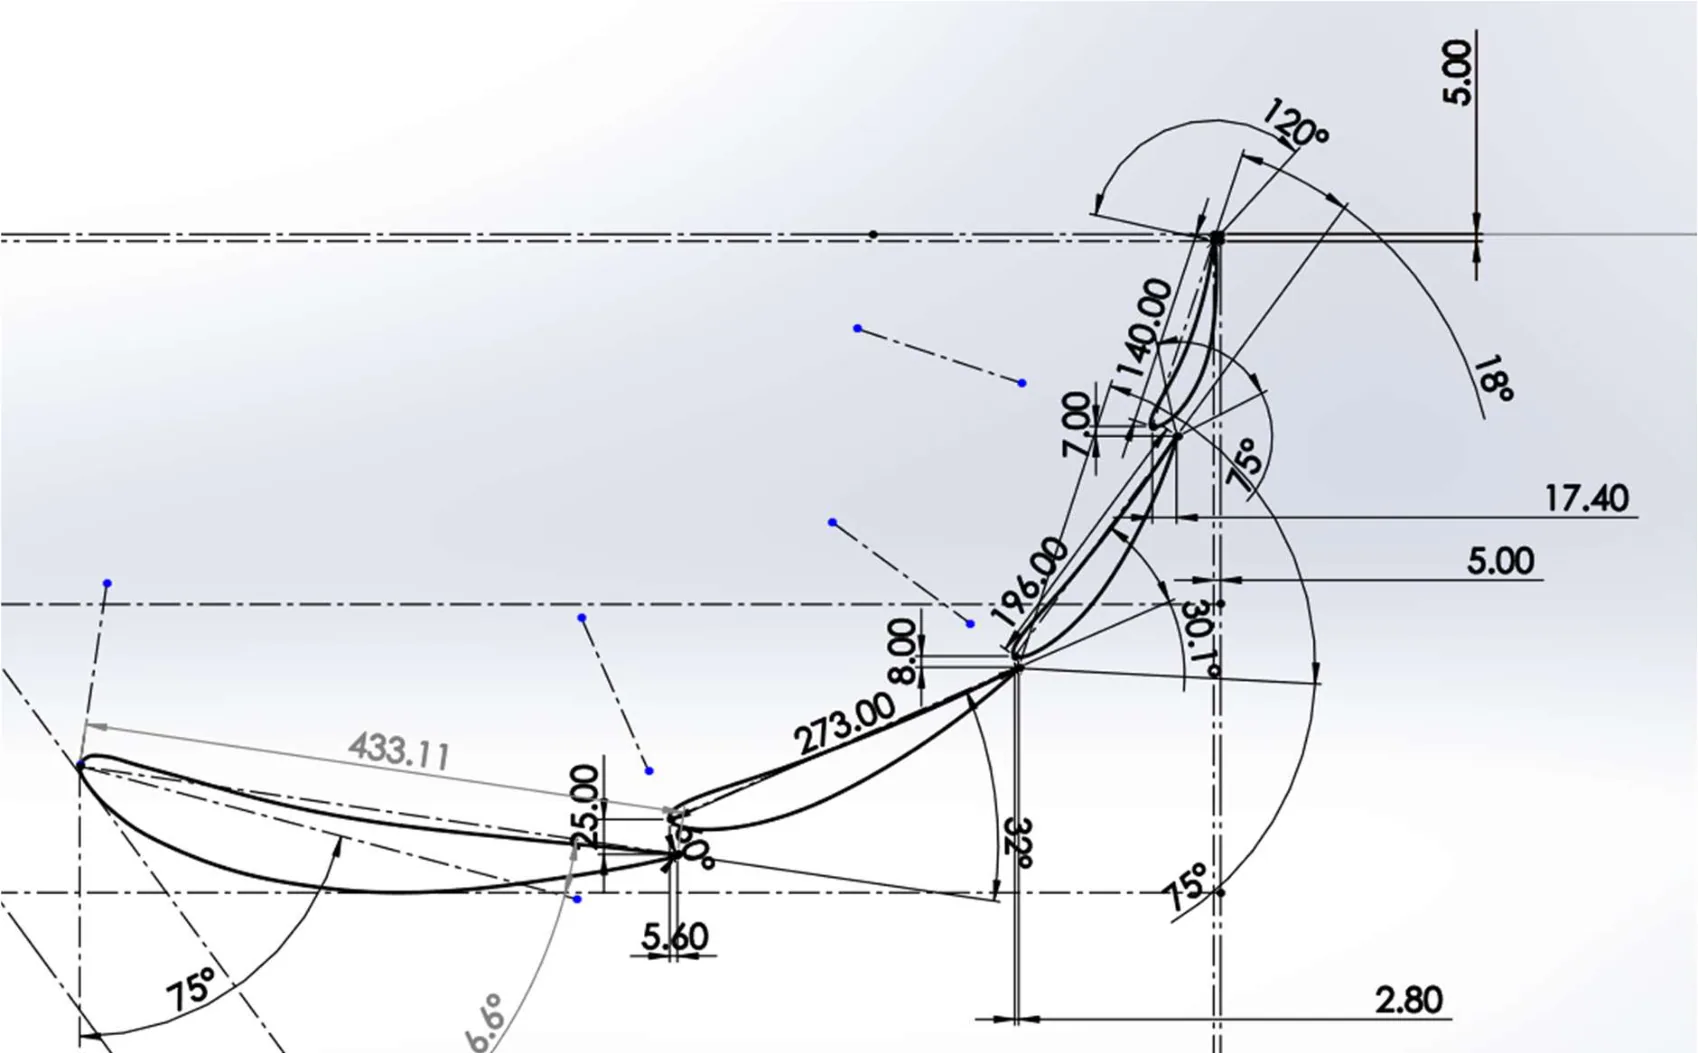
The rear wing combined GOE 447, GOE 448, E423 and NACA 6412 profiles. Three genetic-algorithm stages optimized distance from the headrest and angles of attack (351 design points, 9 iterations), distance and flap chord lengths (402 design points, 10 iterations), then gaps and overlaps (579 design points, 12 iterations). Downforce was maximized subject to a downforce-to-drag ratio of at least 20; the final section ratio was 69.06.
The side diffuser was optimized in a coupled 2D model with the four-element front wing to capture its upwash. A single MOGA study varied inlet height, outlet height, and the horizontal and vertical low-point positions. It evaluated 235 design points over 4 iterations, maximizing combined downforce with downforce-to-drag ratio at least 20. The final section ratio was 36.77.
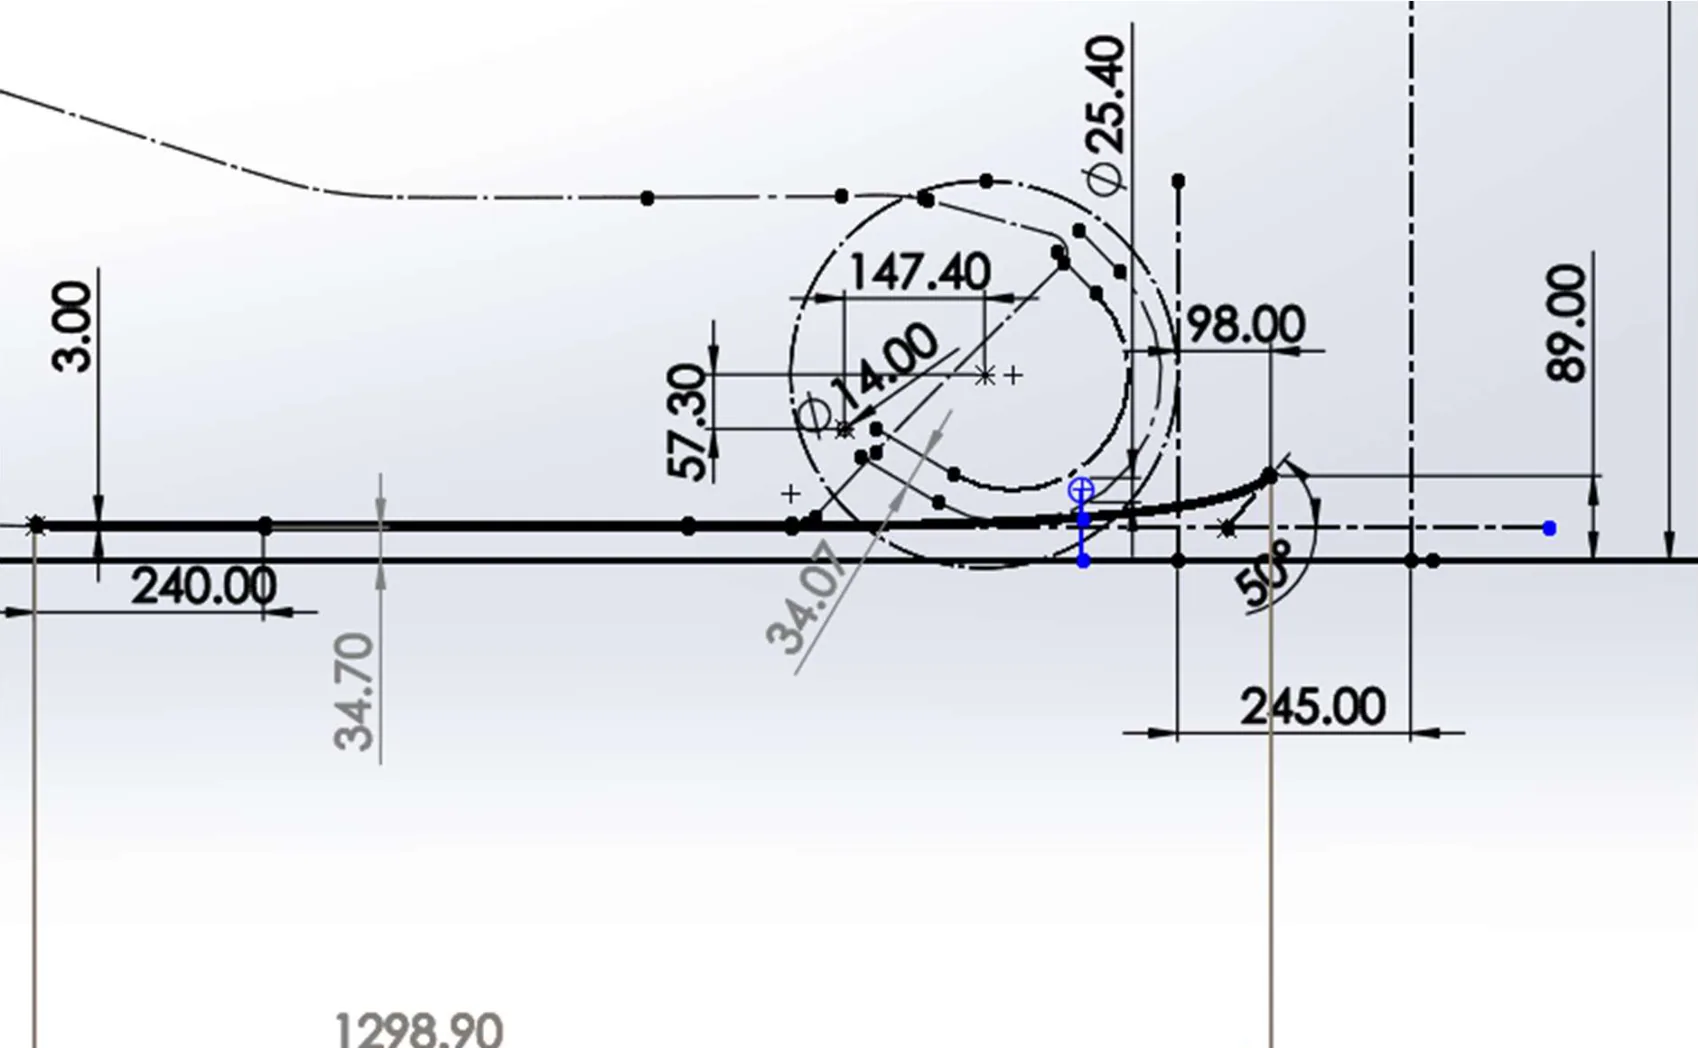
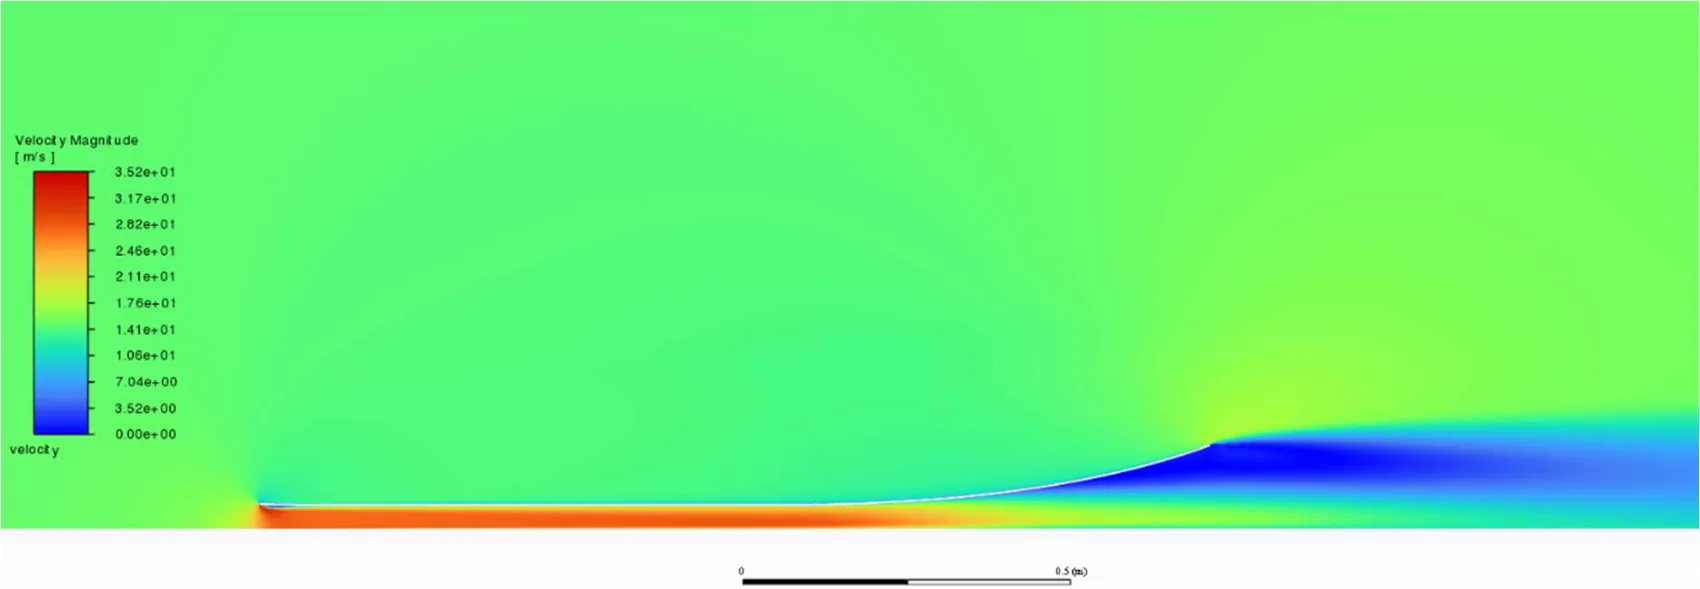
The rear diffuser used a single MOGA study varying outlet distance, outlet height and tangent angle. It evaluated 420 design points over 9 iterations, maximizing downforce with downforce-to-drag ratio at least 20. The chosen 20° geometry achieved a section ratio of 32.92. Each diffuser result belongs to its modeled section, rather than representing an independently measured vehicle-level load. Design-point counts describe individual optimization runs and are not presented as a grand total of unique CFD simulations; the report does not establish such a programme-wide total.
03 / Full-car CFD
Resolving wheel wakes and ground effect
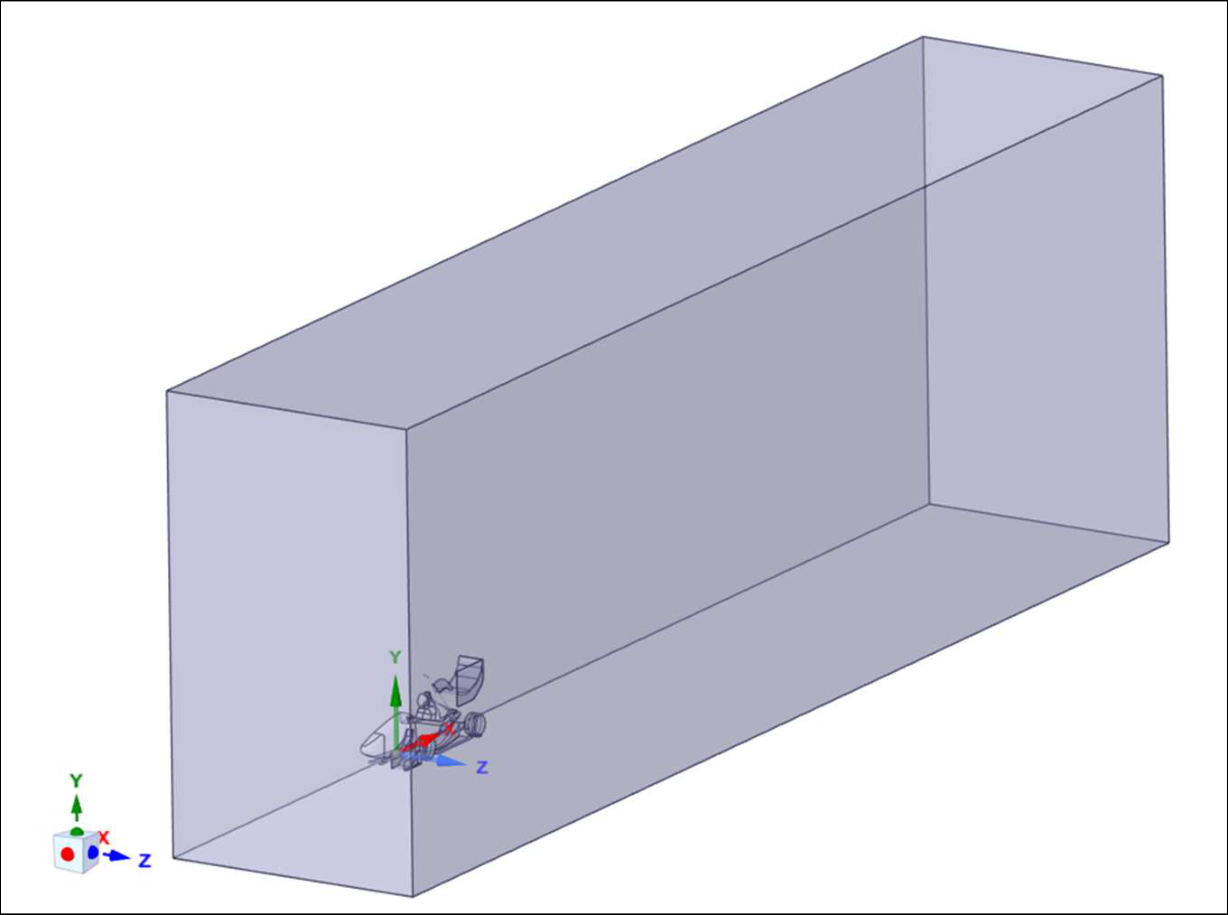
Vehicle-level simulations used a symmetric half-car geometry for zero-yaw conditions, with local bodies of influence to refine component interactions and wakes. The enclosure extended 6 m ahead and 15 m behind the car centre, with 7 m height and 5 m width; the report sizes it for blockage below 5%.
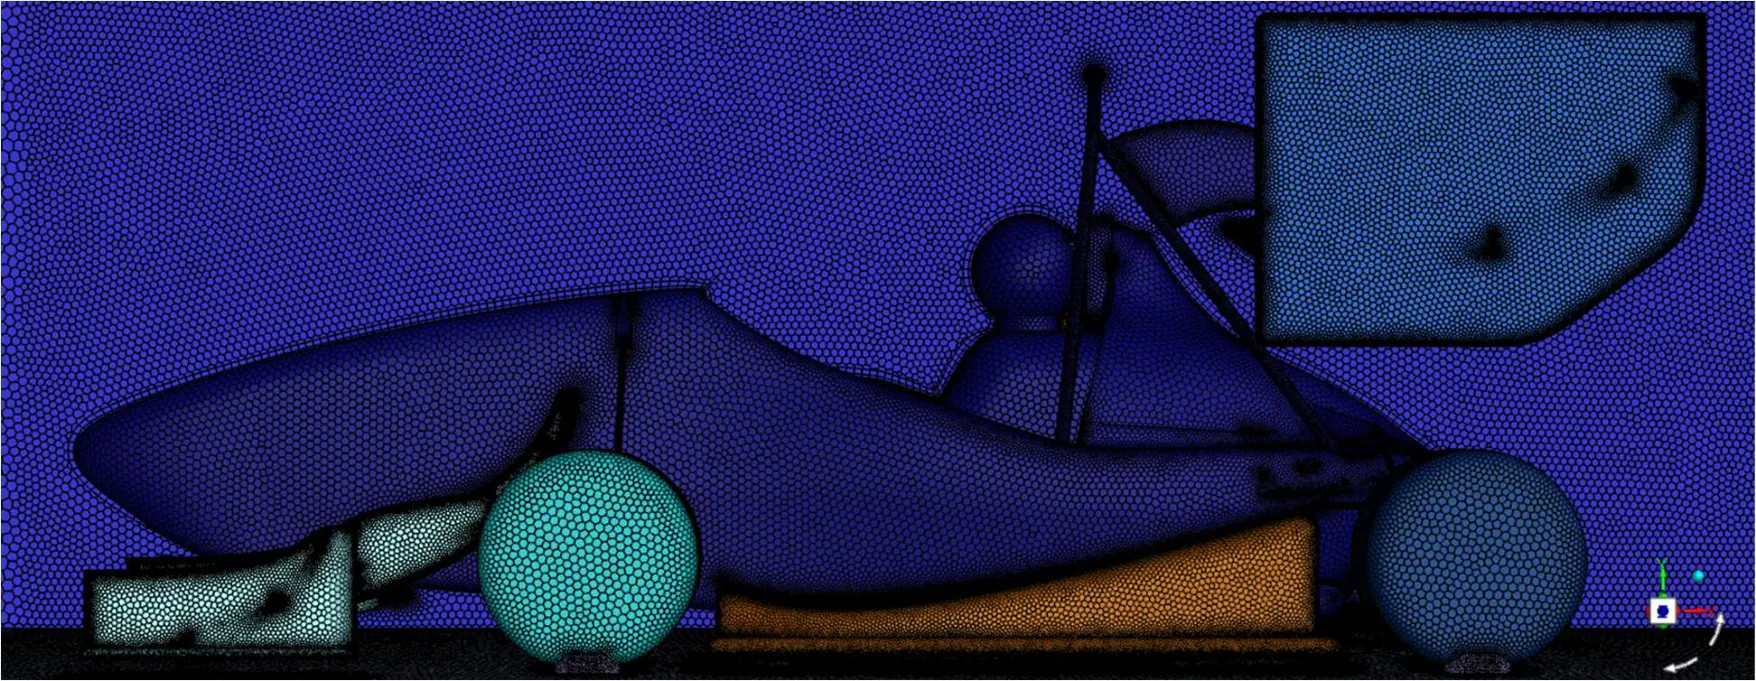
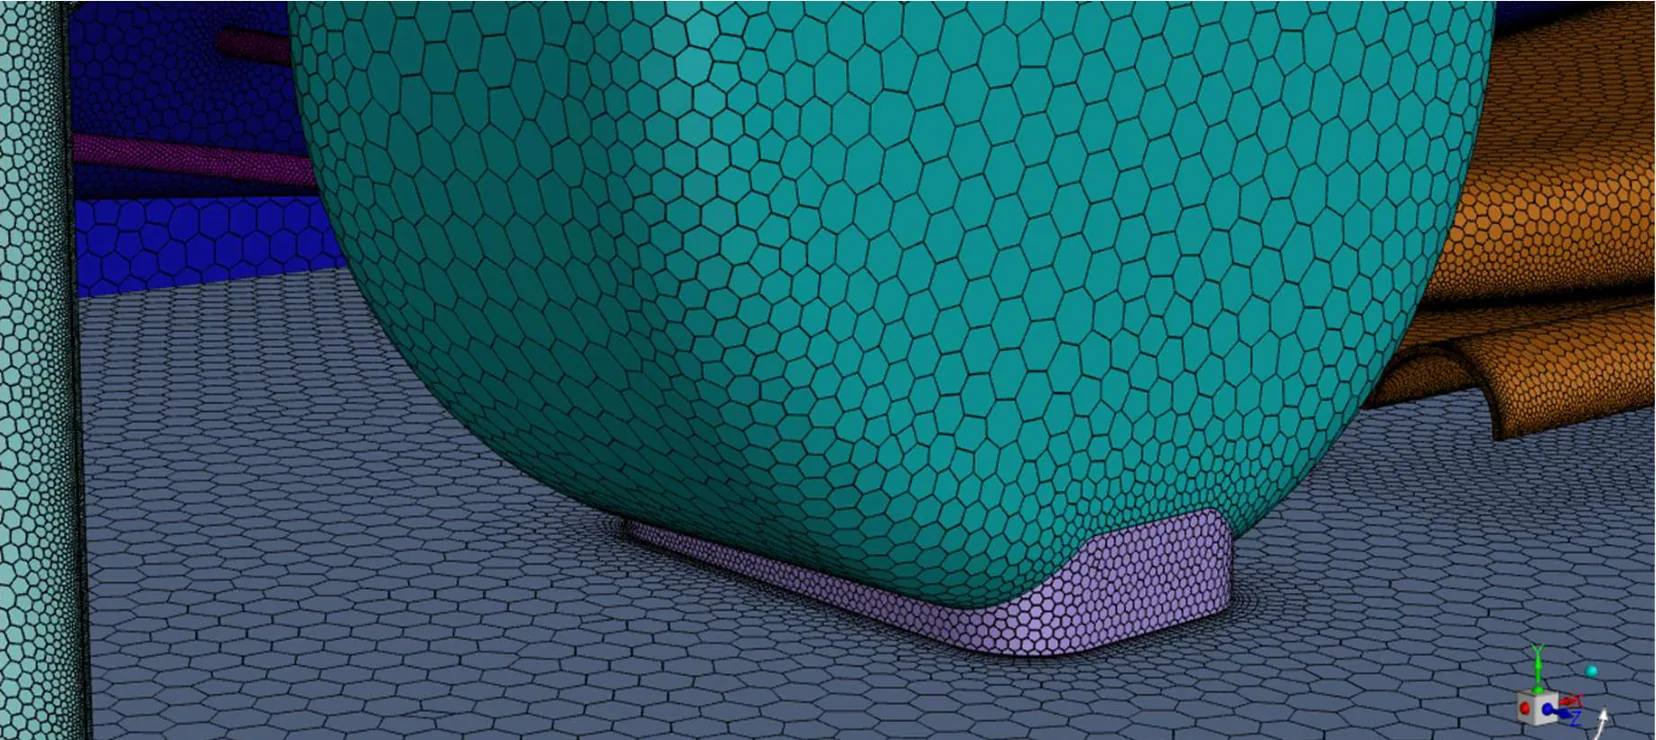
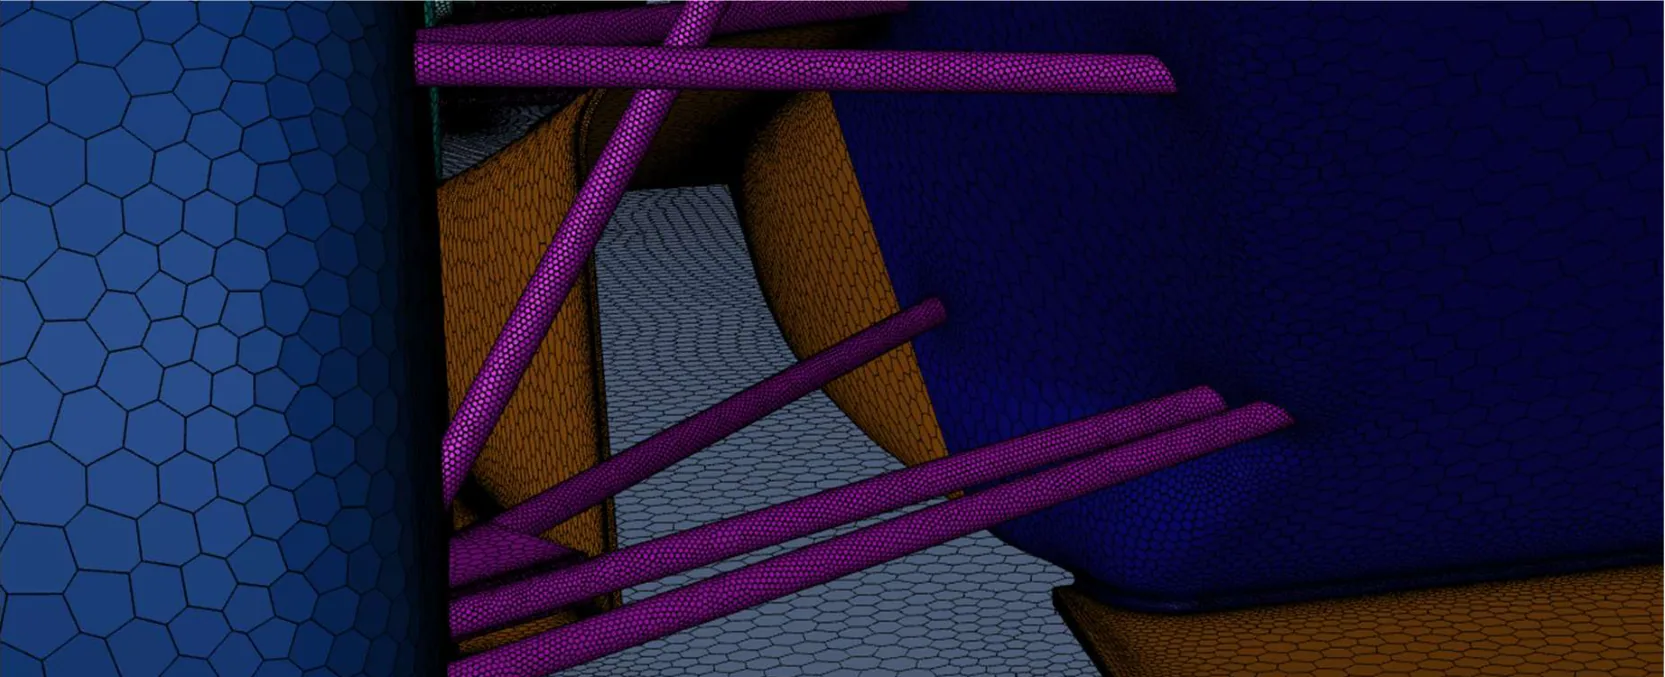
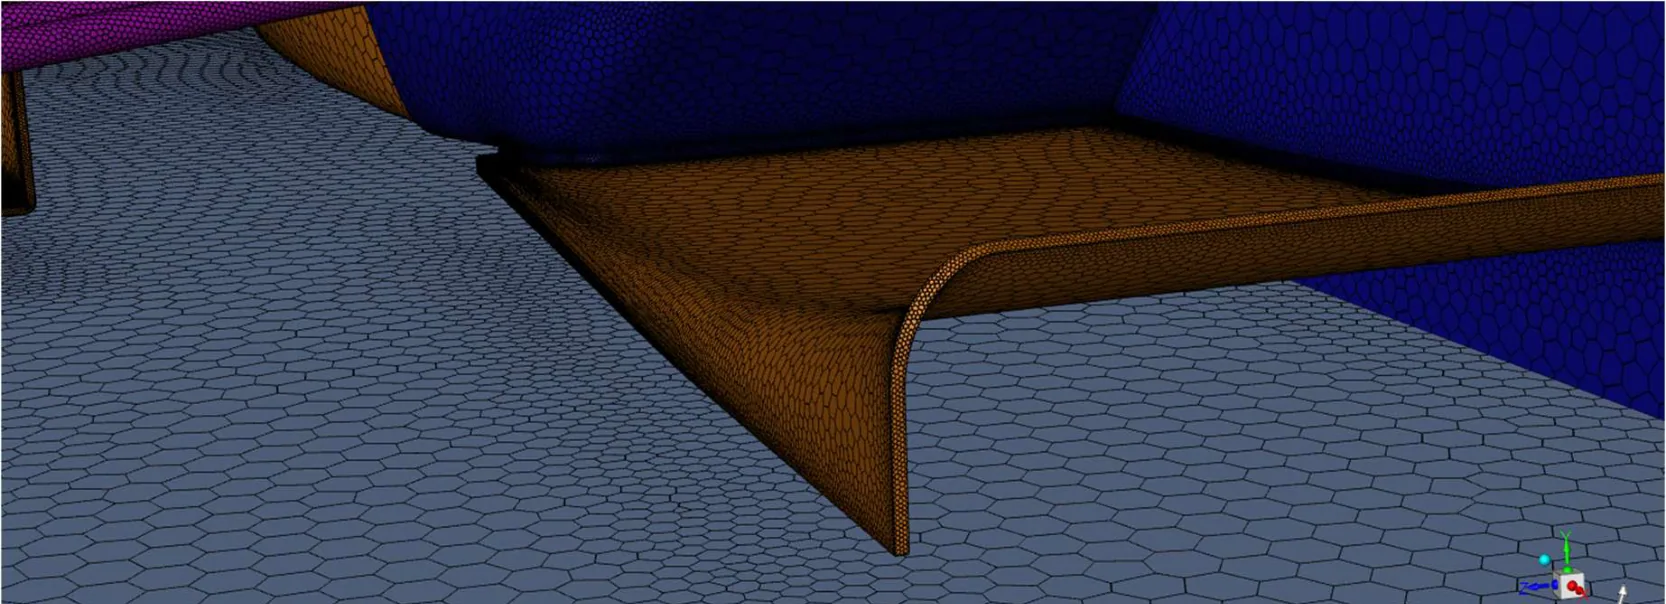
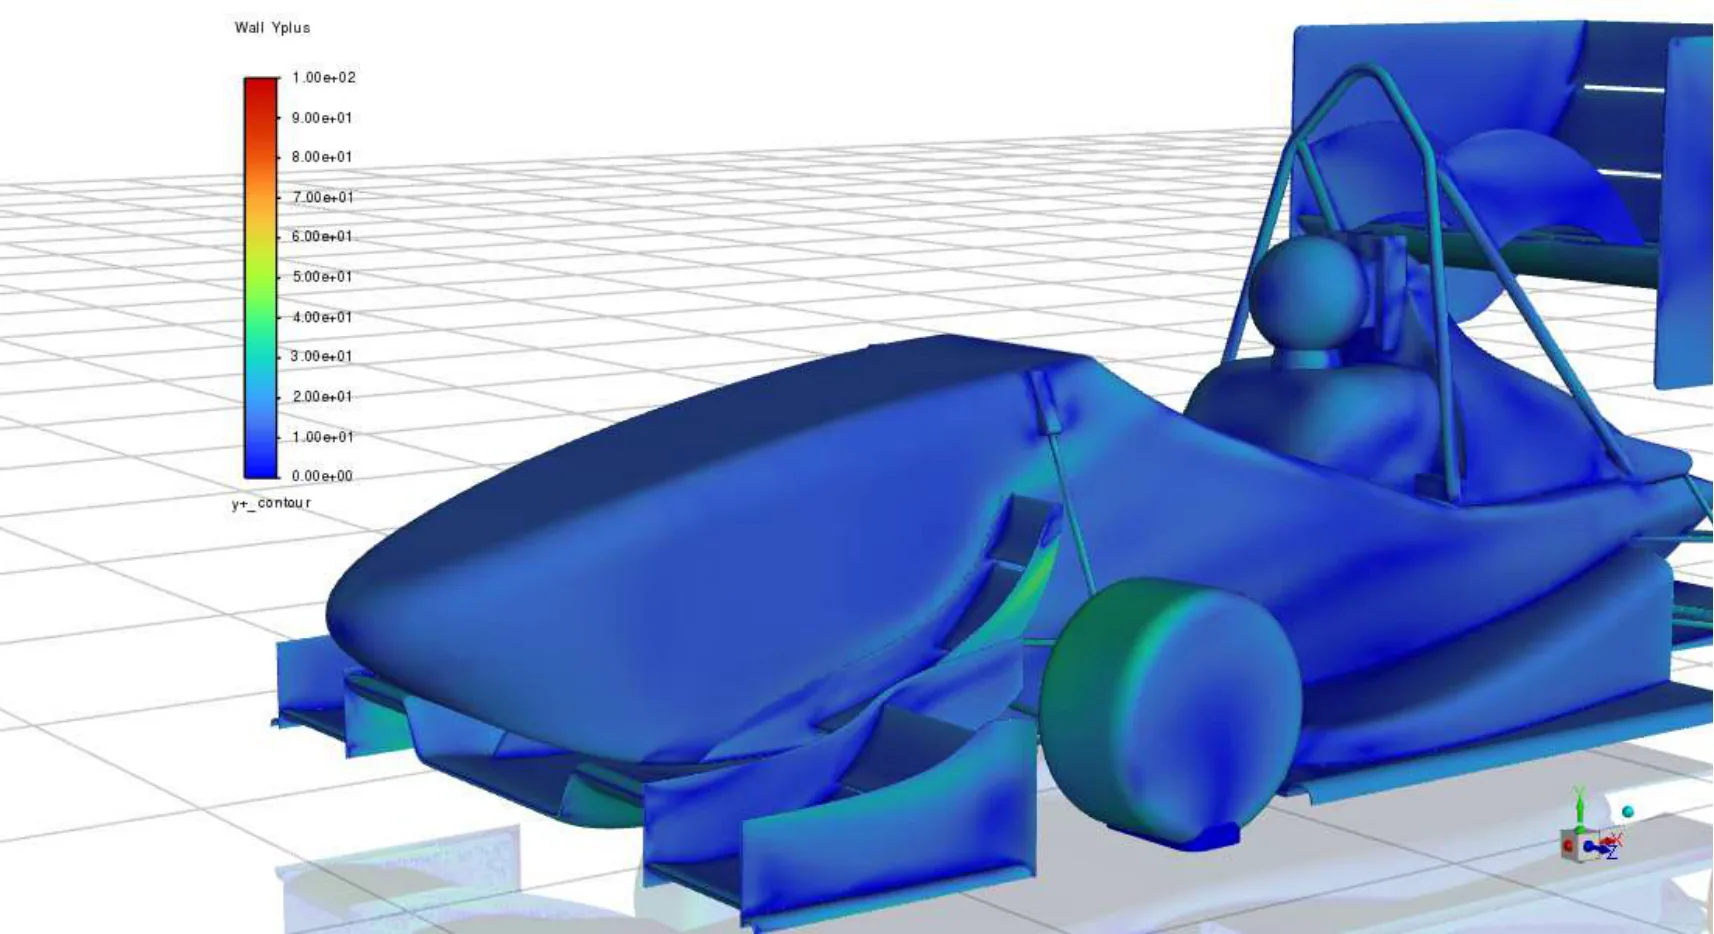
The volume mesh contained 8,153,800 cells, with minimum orthogonal quality 0.2001 and no isolated cells. Near-wall sizing calculations explored y+ ≈ 1 using a 0.034 mm first-layer thickness and fourteen layers at 1.3 growth, as well as a cheaper y+ ≈ 40 alternative. These are calculated mesh strategies, not proof that every surface achieved the target y+.
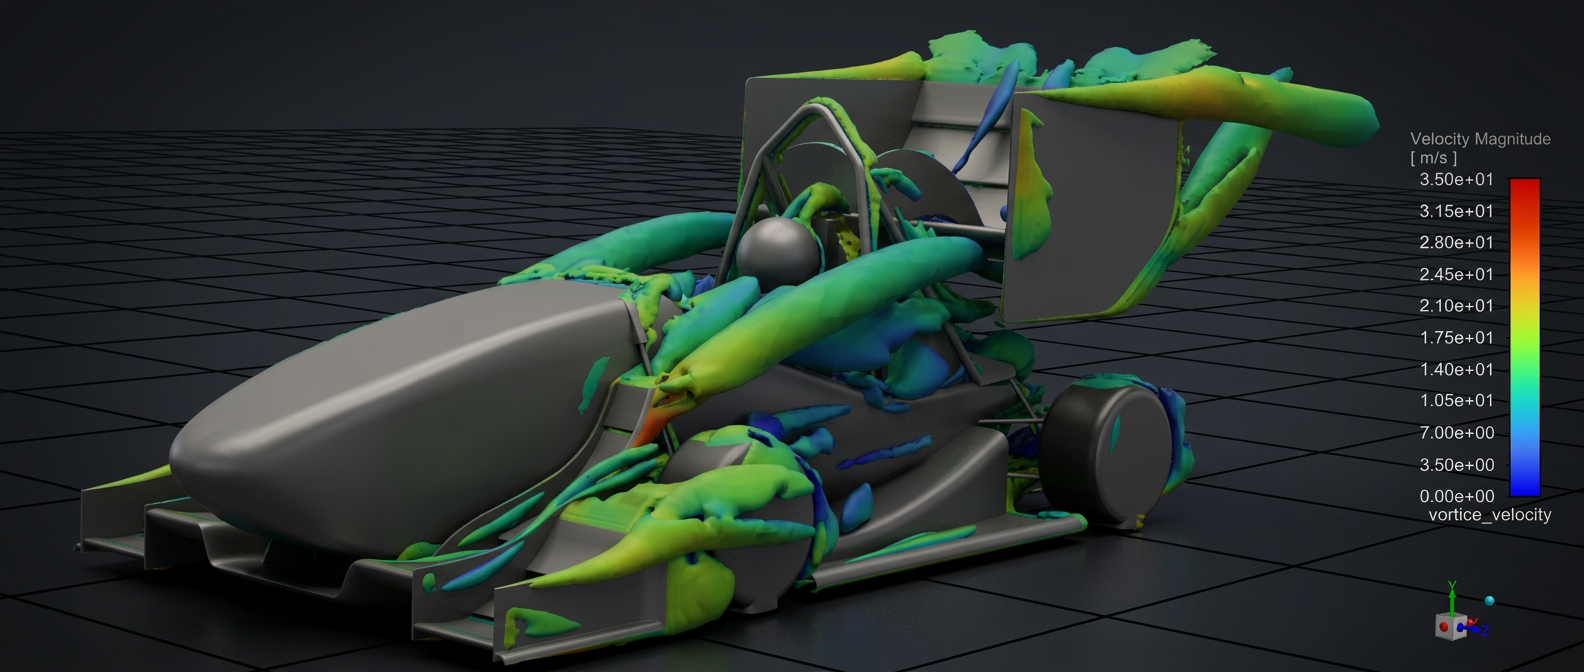
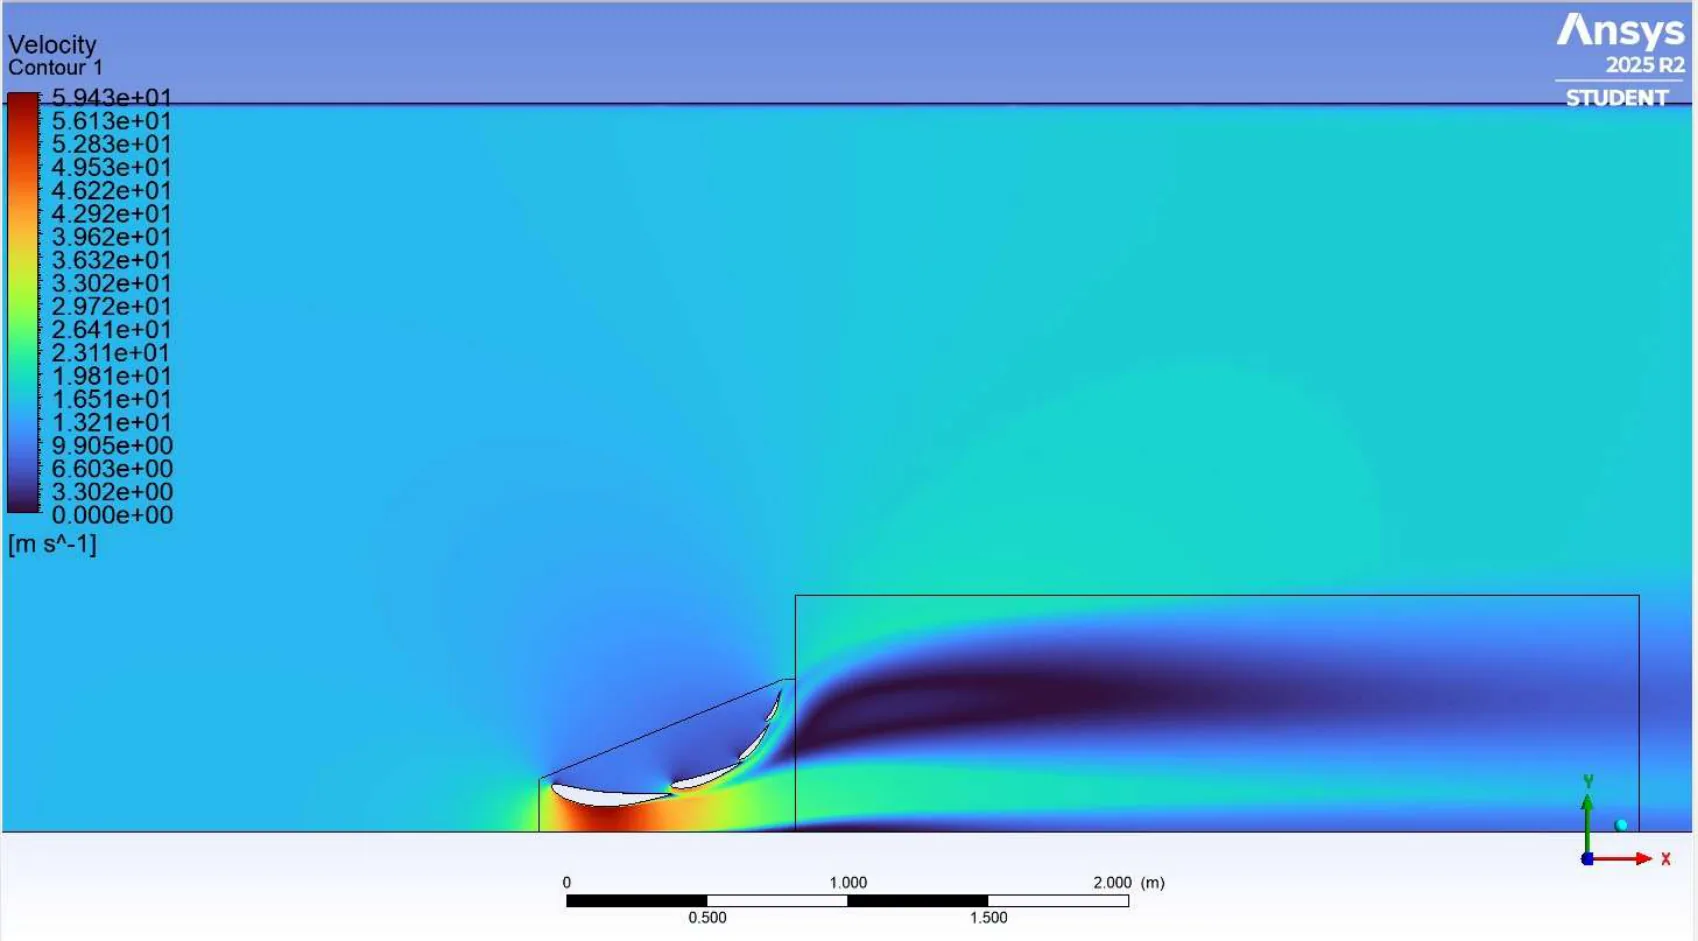
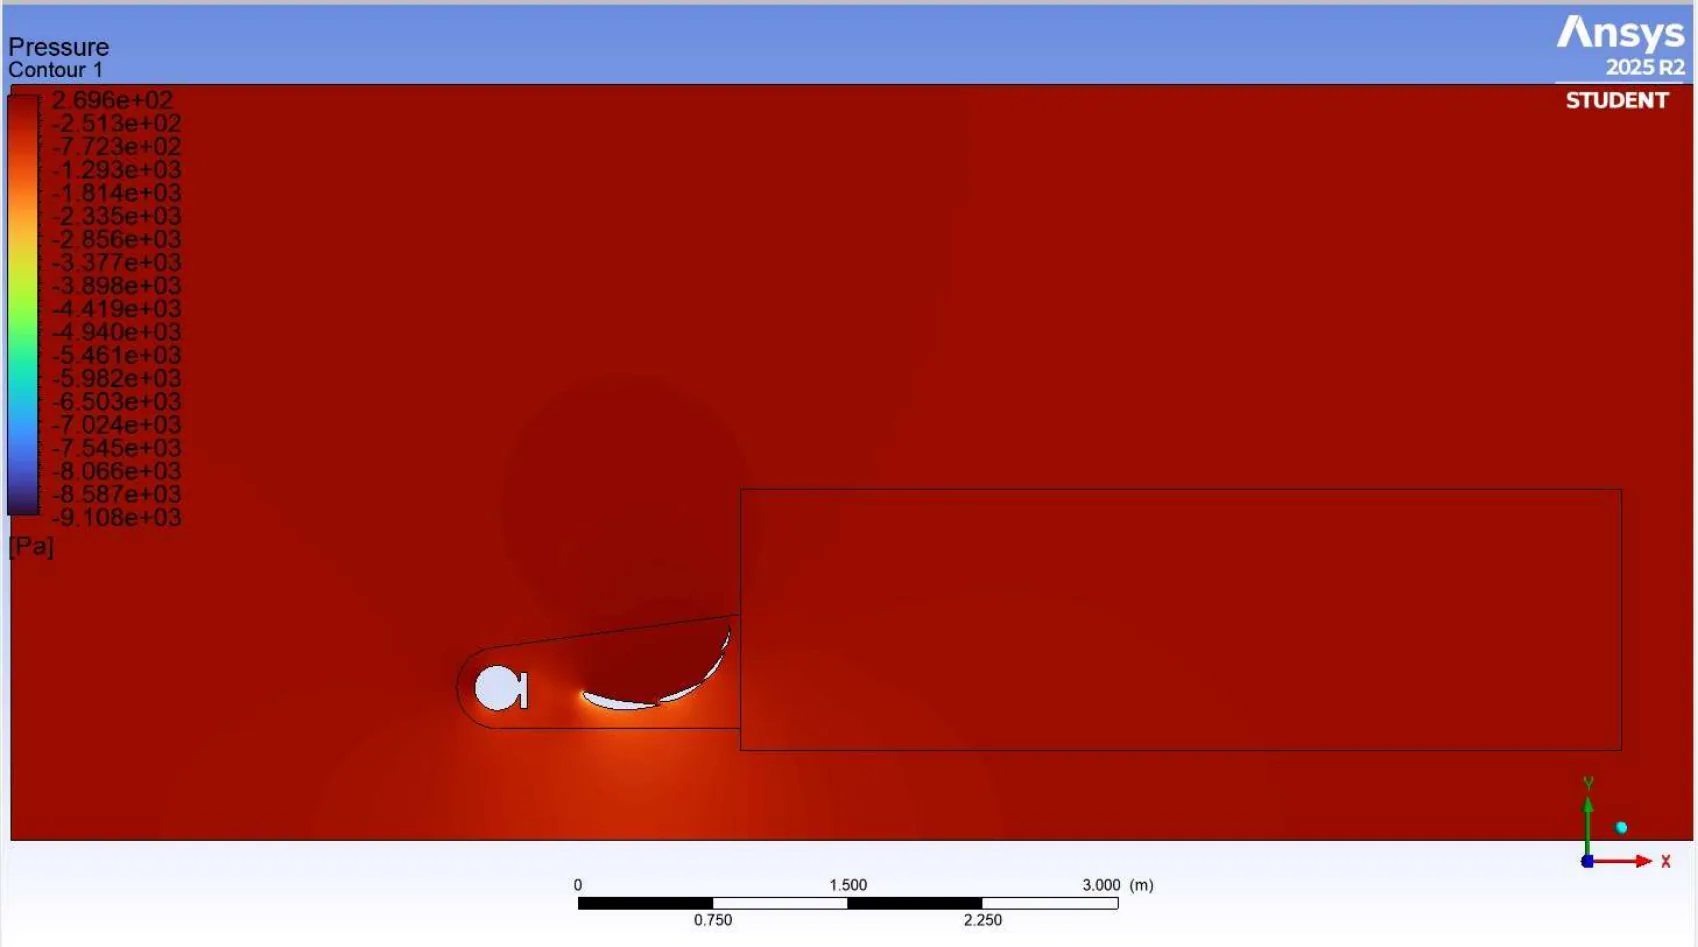
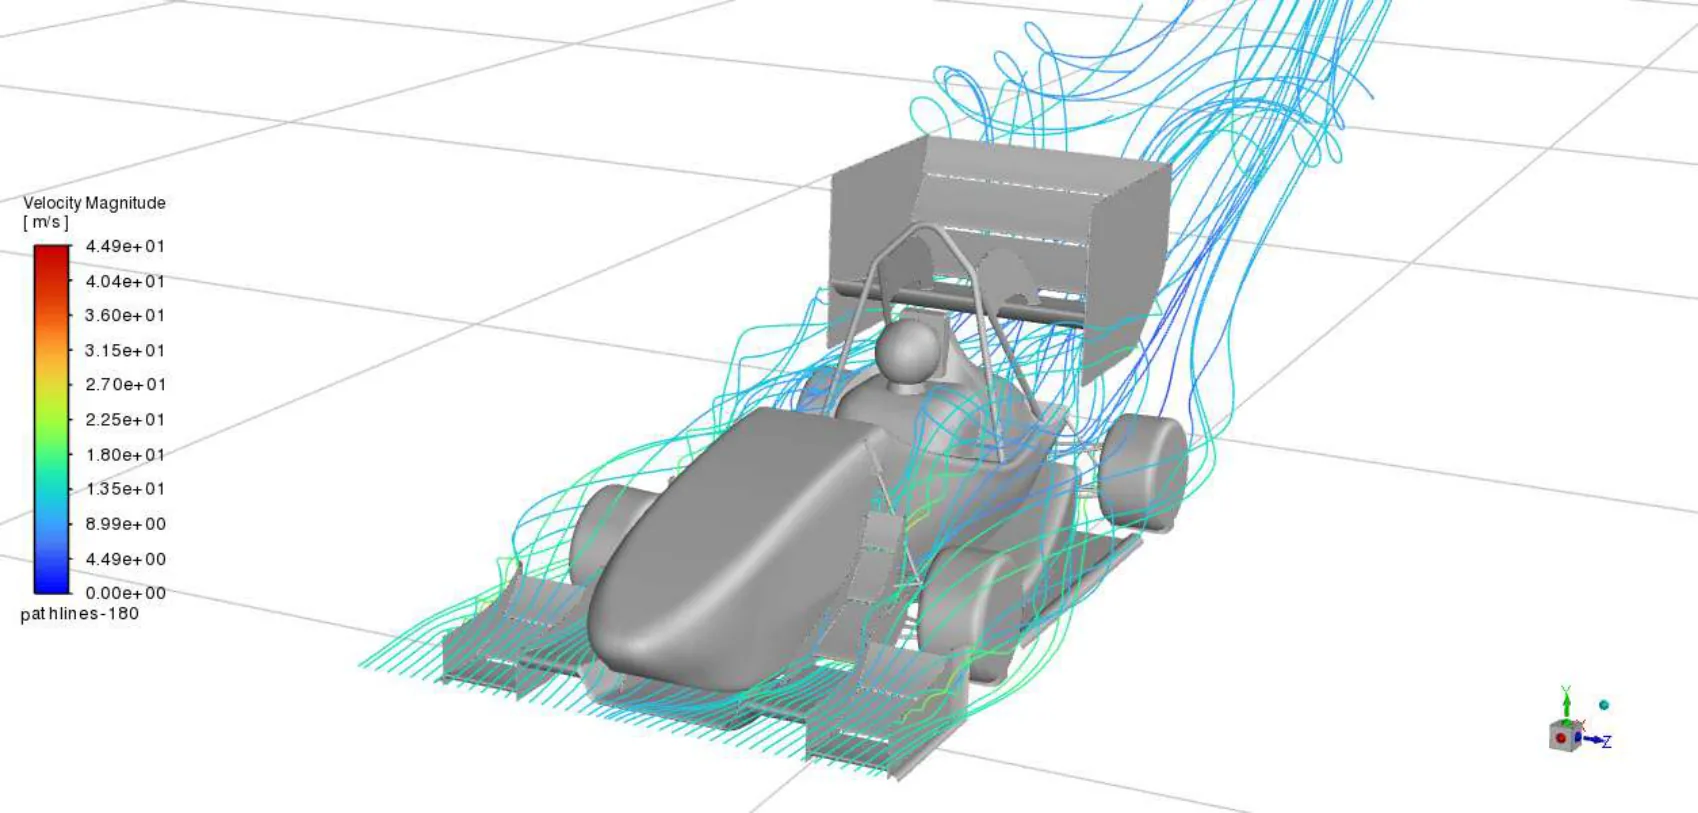
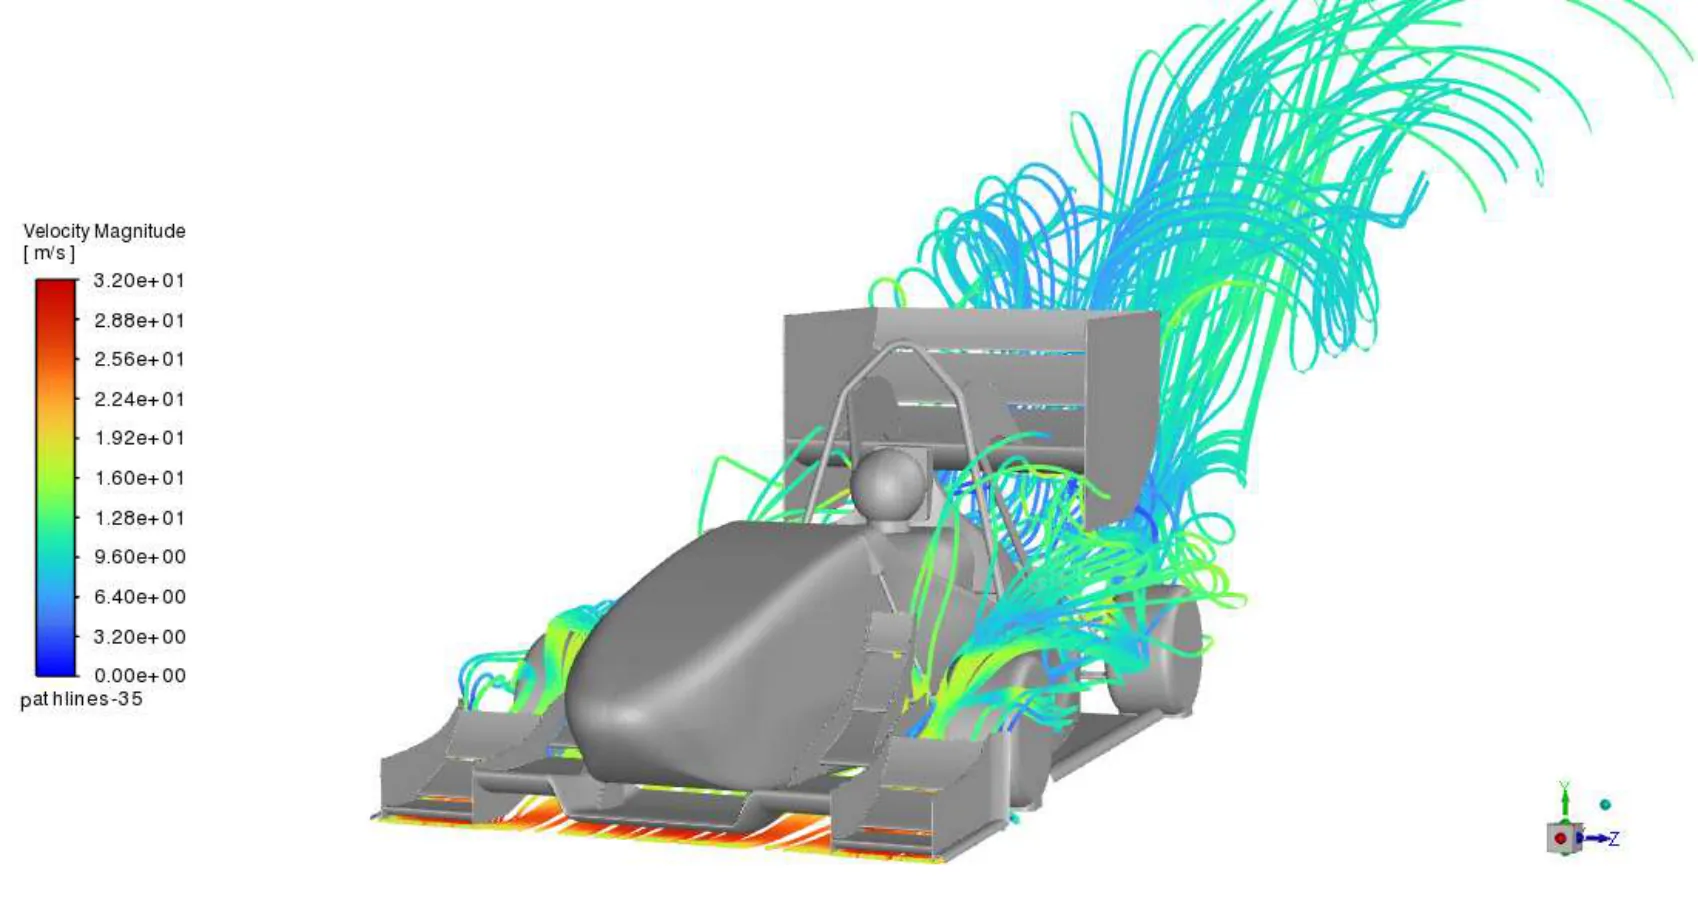
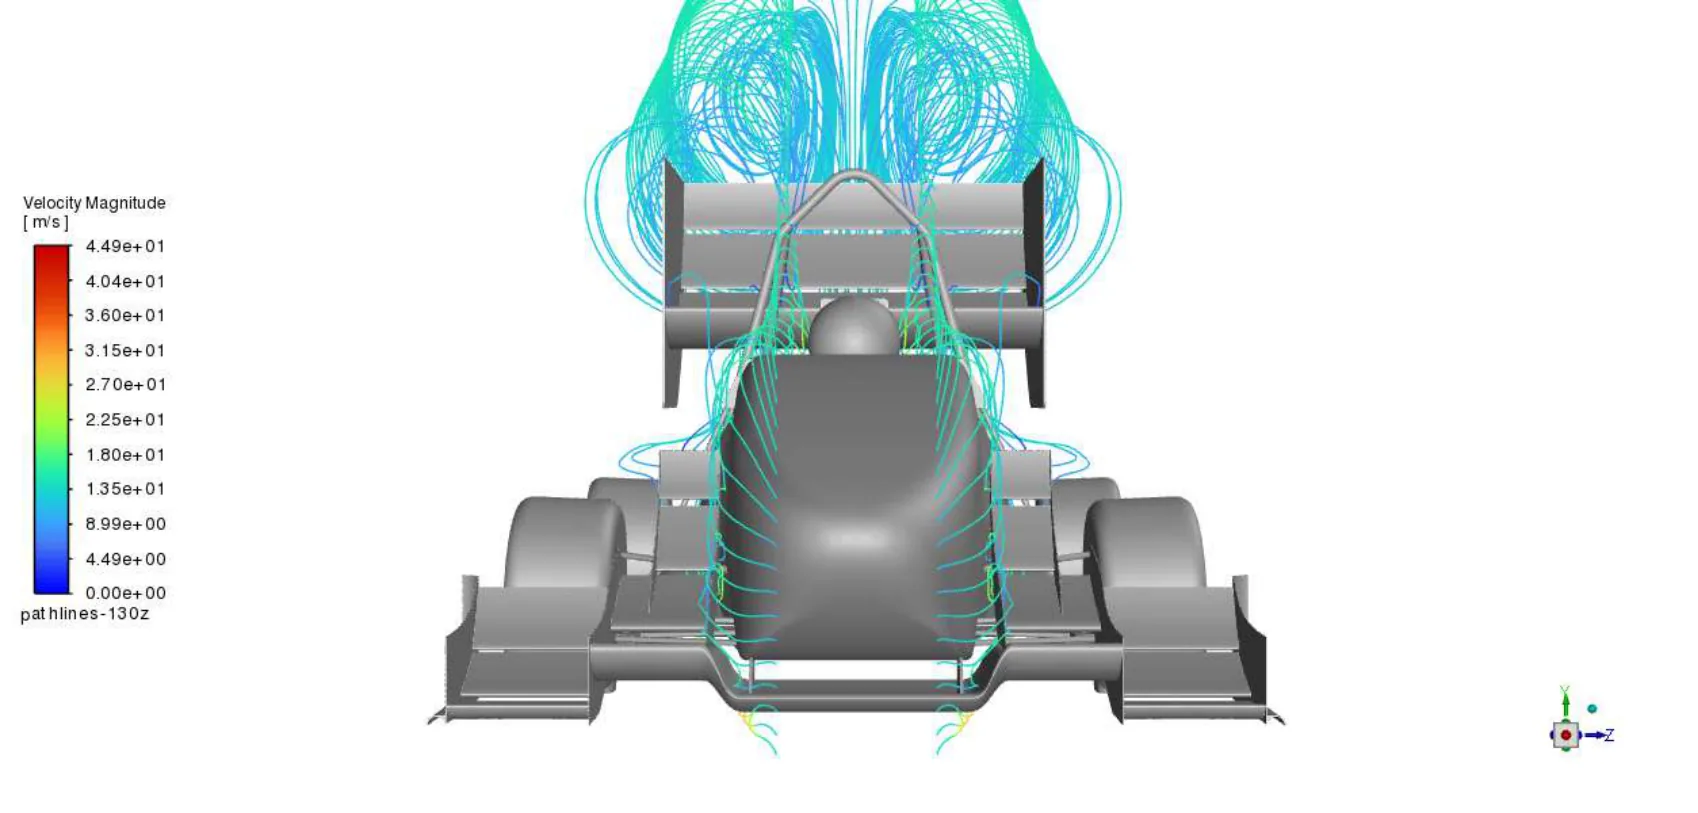
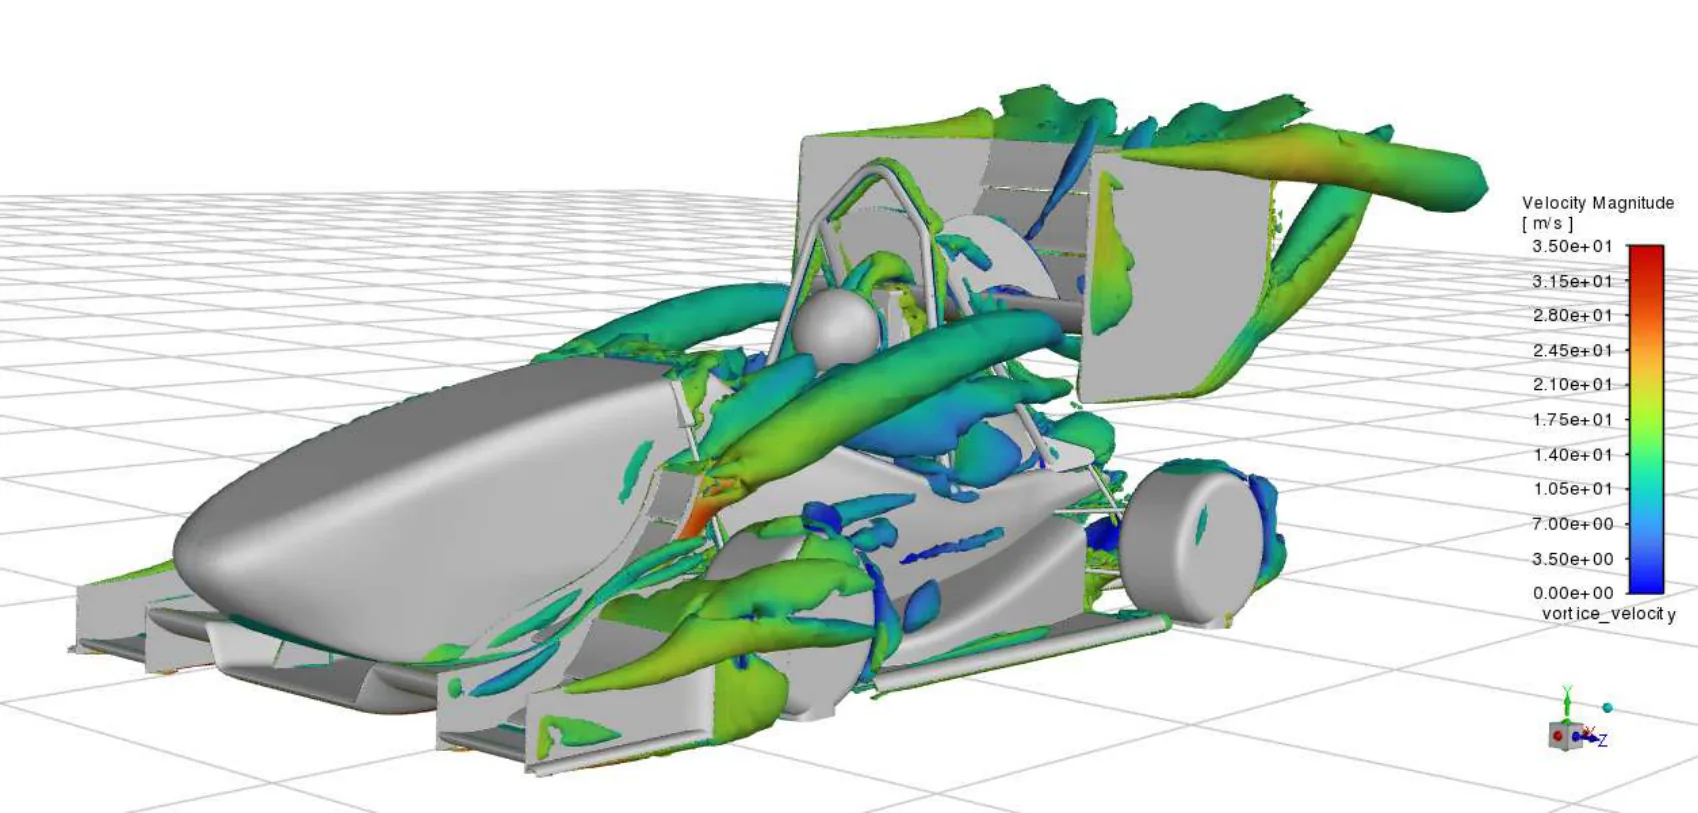
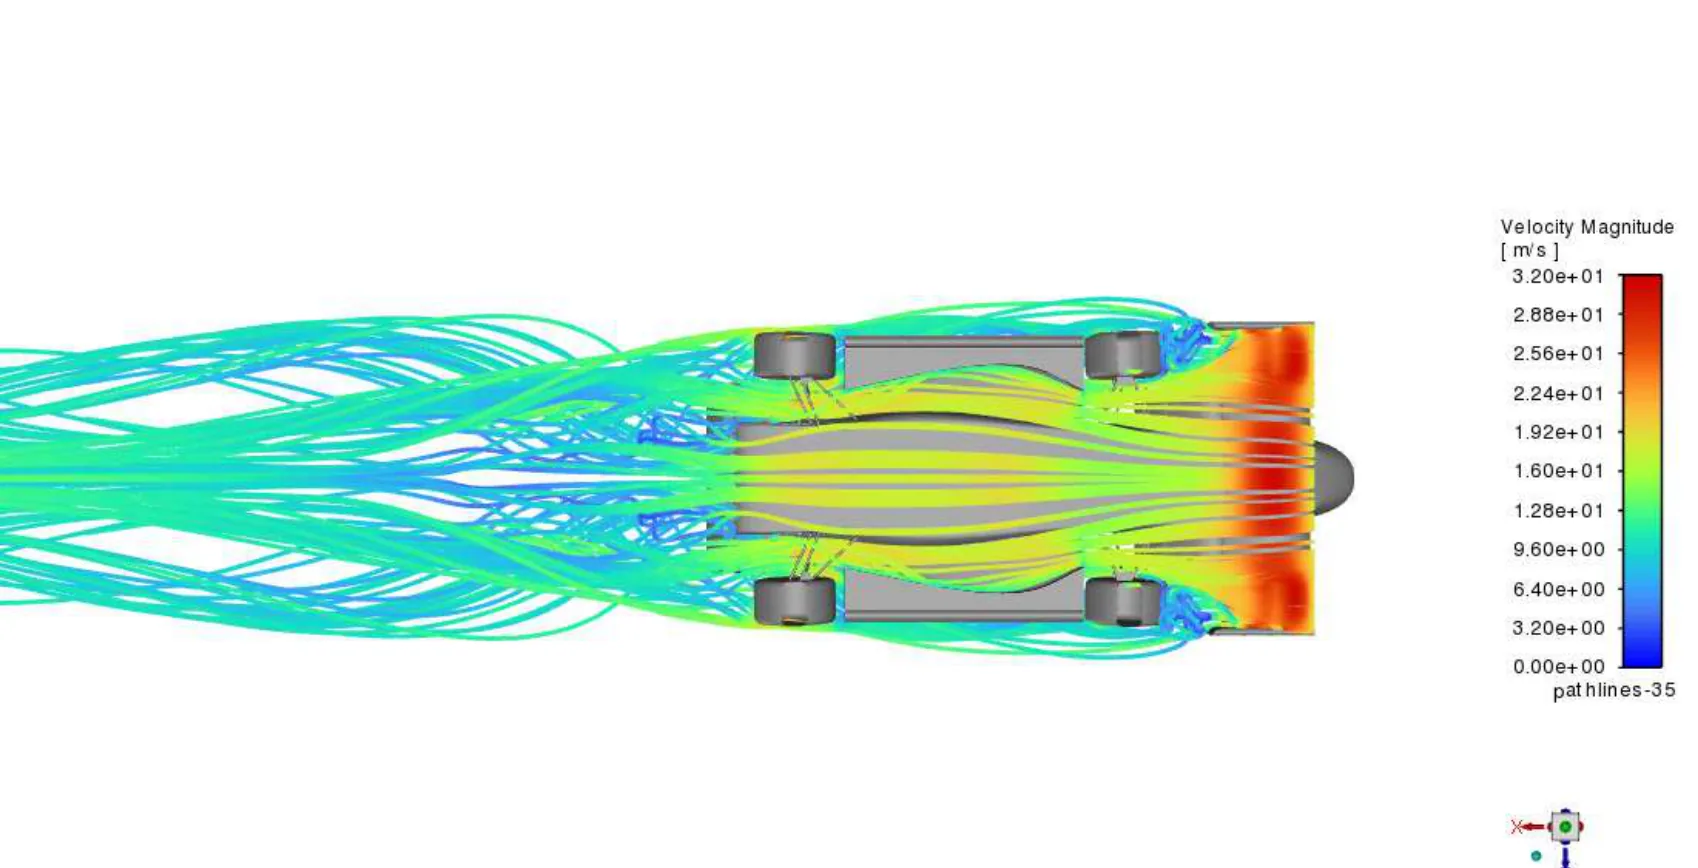
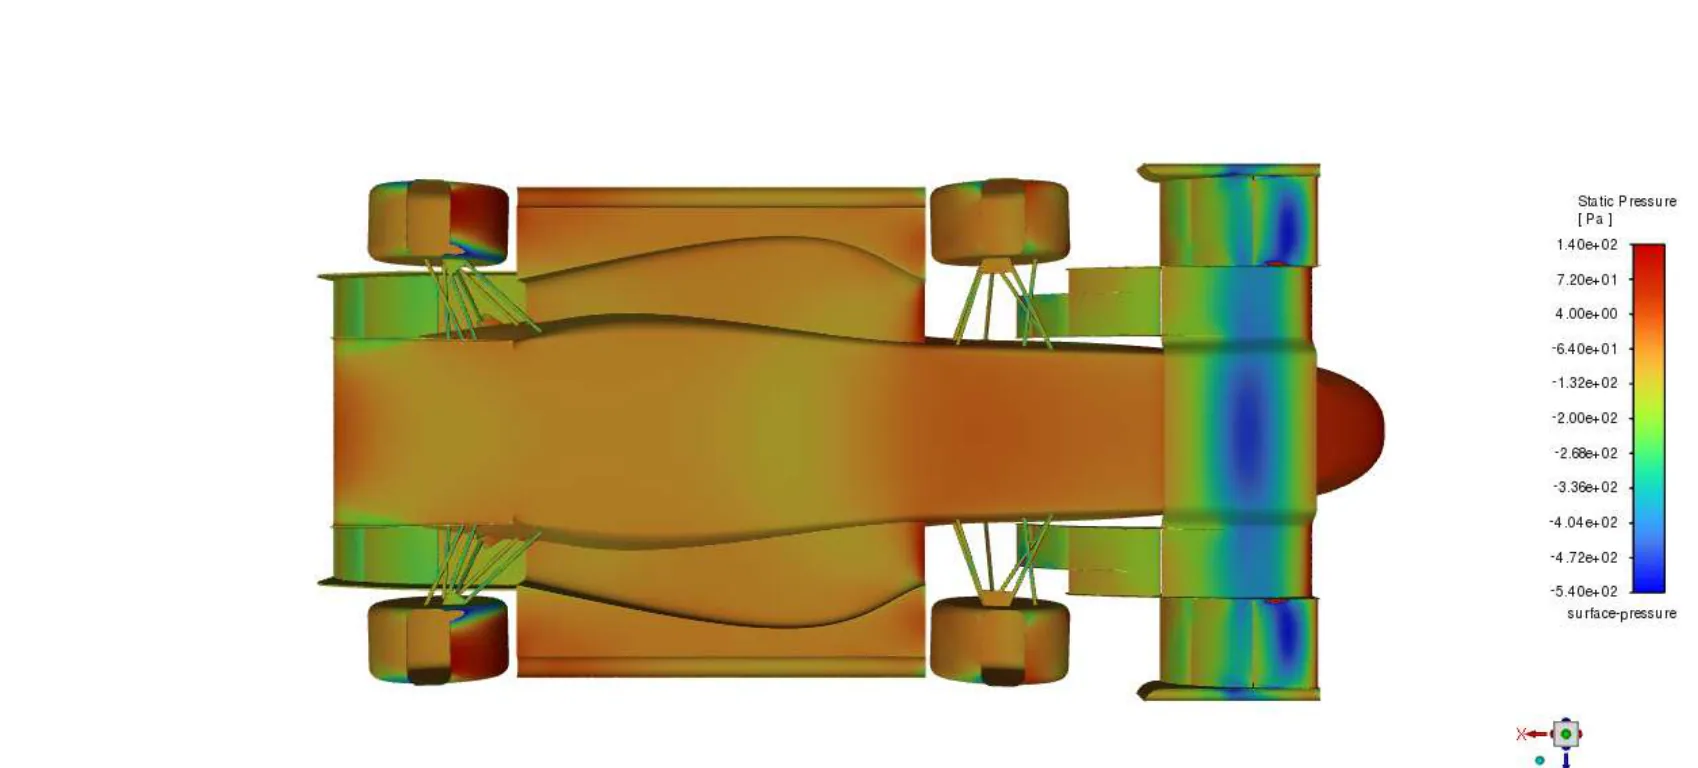
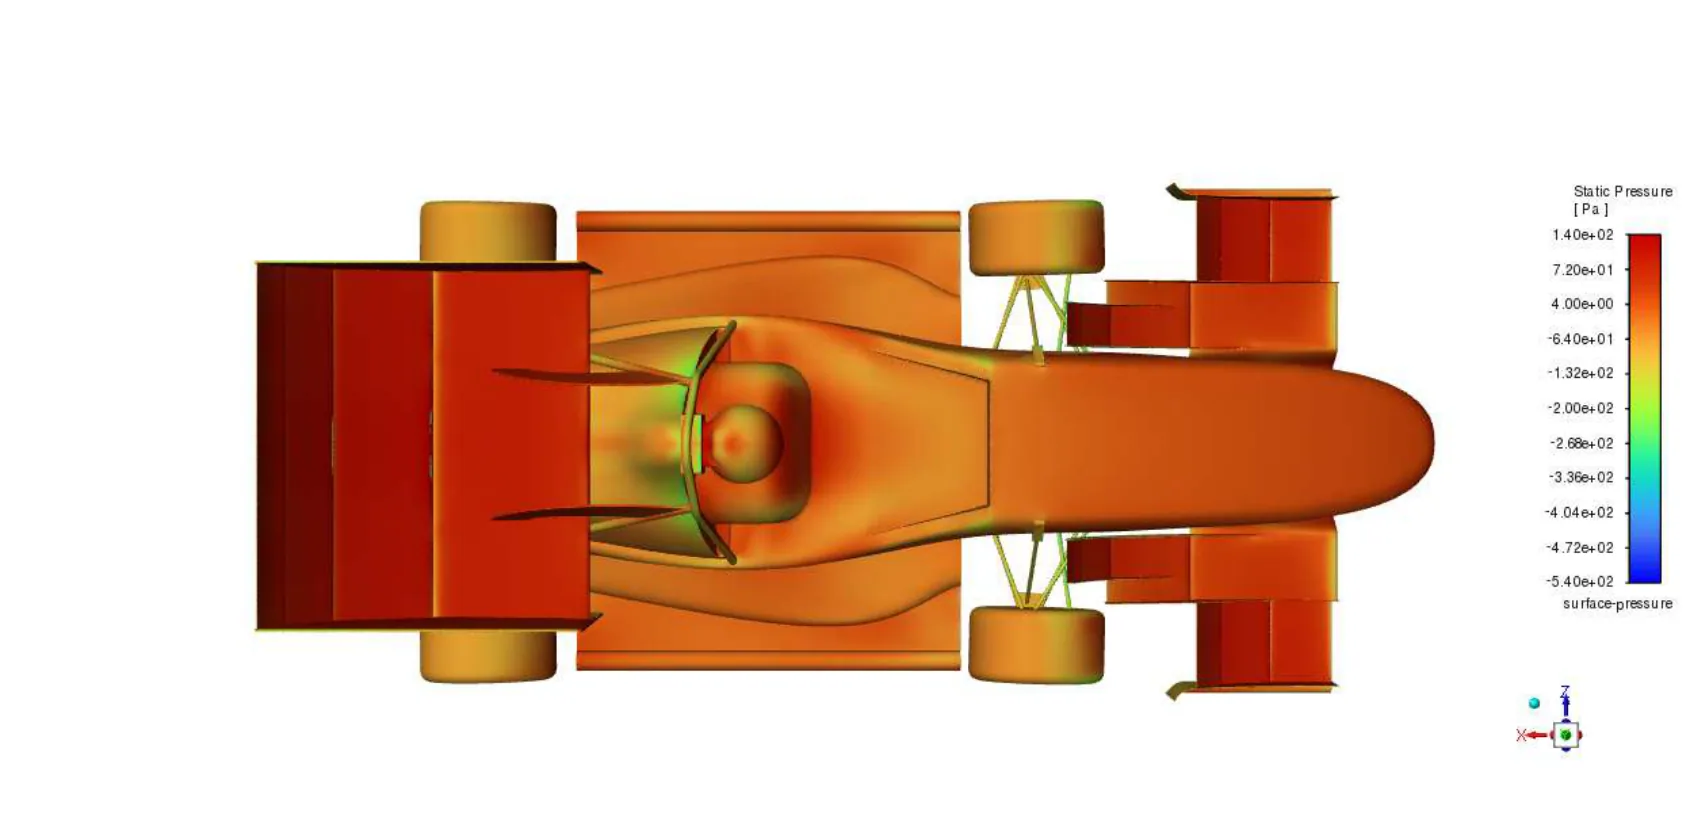
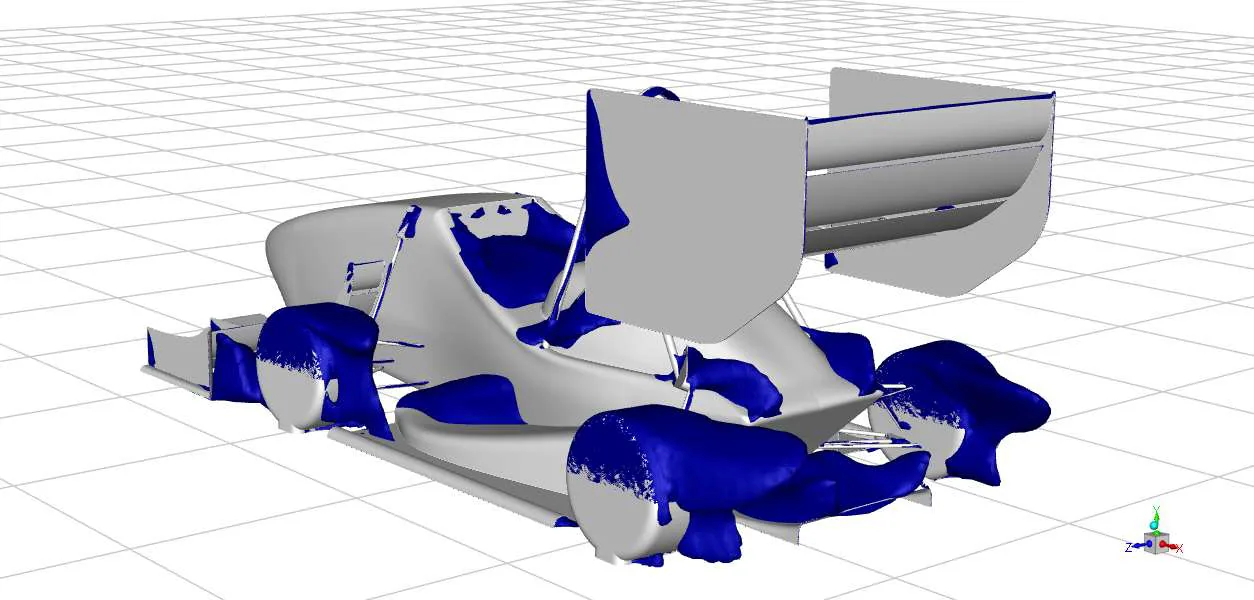
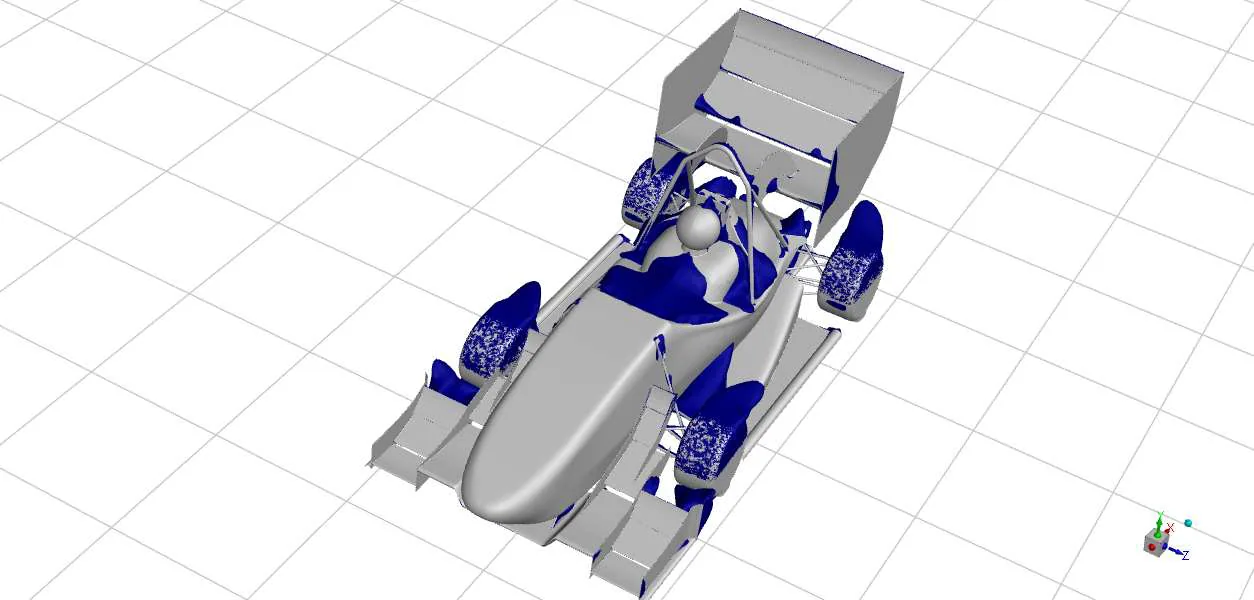
Pathlines and pressure contours were used to inspect front-wing interaction with wheel wakes, underbody acceleration and rear-wing upwash. Residual and force histories document numerical convergence, not experimental validation; force monitors retain fluctuations associated with the separated wake.
04 / Vehicle-level results
Ride height changes both force and balance
At 30 mm ride height and zero pitch, the full-car simulation produced 235.51 N downforce at 15 m/s and 553.50 N at 22.5 m/s. Raising ride height to 45 mm reduced those values to 216.15 N and 502.28 N respectively, while shifting the reported centre of pressure forward. These results demonstrate ride-height sensitivity rather than an independently validated lap-time gain.
The 15 m/s simulated downforce is below the report’s 566.8 N cornering target. Section-level loads must not be added to substitute for the full-car result. Future work calls for performance comparisons with and without the package and angle-of-attack adjustments to address understeer or oversteer.
Simulated downforce by ride height
| Ride height (mm) | Speed (m/s) | Pitch (°) | Downforce (N) | Drag (N) | Cl | Cd | CoP from front track (mm) |
|---|---|---|---|---|---|---|---|
| 30 | 15 | 0 | 235.51 | 100.03 | 3.05 | 1.30 | 469.11 |
| 30 | 22.5 | 0 | 553.50 | 221.04 | 3.19 | 1.27 | 429.27 |
| 45 | 15 | 0 | 216.15 | 99.58 | 2.80 | 1.29 | 381.73 |
| 45 | 22.5 | 0 | 502.28 | 223.04 | 2.89 | 1.28 | 374.41 |
| 49 | 15 | 0.5 | 198.12 | 95.37 | 2.57 | 1.24 | 374.38 |
Table 04-01 — Full-car CFD results. Positive downforce and the coefficient convention are retained; these are simulated results.
05 / Manufacture & physical checks
From composite parts to track feedback
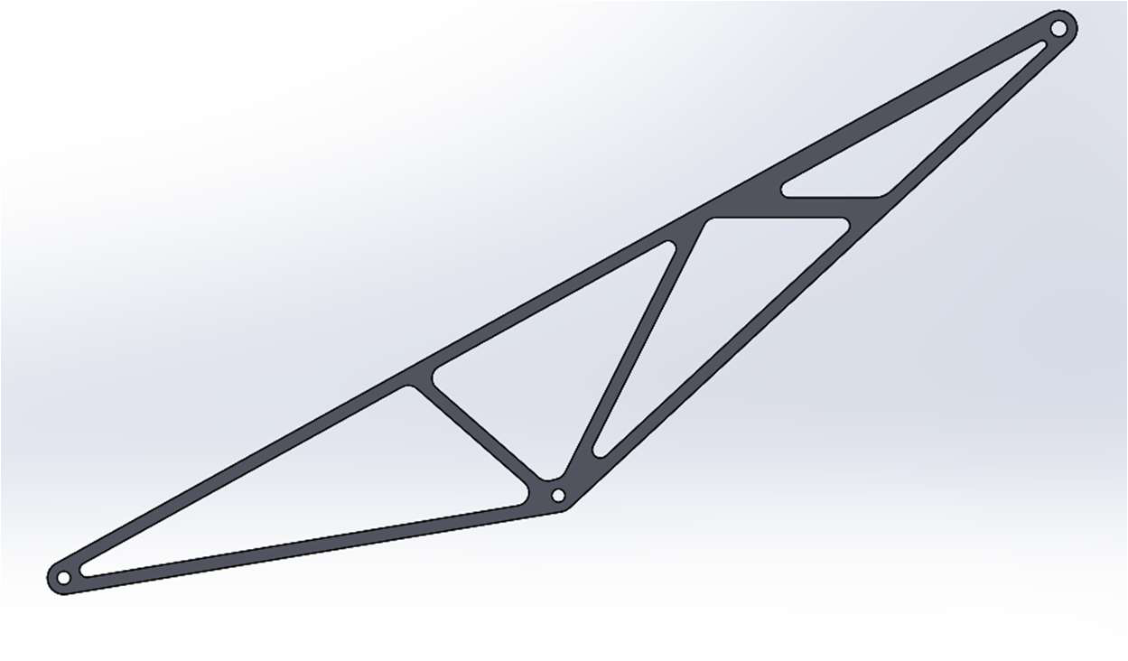
The report documents split-mold carbon-fibre wet lay-up and vacuum bagging, with tooling developed through 3D printing, CNC-machined MDF and foam-pattern/fibreglass-mold routes. Internal ribs, bonded joints and mounting hardware translated the optimized profiles into installed components. The rear-wing brackets connected the wing assembly to the chassis and maintained its position and angle. Track testing at Hingurakgoda exposed a bracket failure during reported crosswind gusts up to 90 km/h. Diagonal bracing and revised fillets were subsequently introduced to improve the load path and support the installed wing.
Wool-string tuft testing checked the rear wing’s last two, high-angle elements for flow behaviour. This is qualitative physical evidence, not a measured downforce validation. The report contains no wind-tunnel or instrumented on-track force results; the previously supplied wind-tunnel work belongs to the wider programme and is not verified by this document.